Altcoin valuation determines what a digital asset is actually worth, while market dynamics explain why that price changes every second. Many investors look at a low token price like $0.05 and assume it is cheap, only to discover that massive future token unlocks dilute their investment to near zero. Real market analysis looks past short-term hype by measuring circulating supply, protocol cash flows, order book liquidity, and capital rotation.
This comprehensive guide breaks down the core financial mechanics that drive cryptocurrency valuations. You will learn how to evaluate tokenomics, calculate true market value, analyze structural liquidity, and protect your capital from common crypto valuation traps.
At a Glance: Foundational Valuation Snapshot
| Analytical Metric | Formula or Data Source | Primary Analytical Purpose | Key Limitation or Blind Spot |
| Market Capitalization | Current Price × Circulating Supply | Gauges relative current size and liquidity tier. | Excludes future emissions and locked insider tokens. |
| Fully Diluted Valuation (FDV) | Current Price × Maximum Supply | Quantifies long-term dilution risk and future supply overhang. | Assumes all future tokens will enter circulation at the current price. |
| NVT Ratio | Market Cap ÷ Daily On-Chain Transaction Volume | Serves as crypto’s equivalent to the Price-to-Earnings (P/E) ratio. | On-chain wash trading or internal contract sweeps can distort volume data. |
| Total Value Locked (TVL) | Cumulative USD Value of Deposited Smart Contract Assets | Measures capital retention, protocol trust, and platform liquidity. | High inflationary farm yields can temporarily artificially boost deposits. |
| MVRV Z-Score | (Market Cap − Realized Cap) ÷ Standard Deviation(Market Cap) | Pinpoints extreme macro market overvaluation or undervaluation. | Best suited for mature layer-1 assets with deep historical transaction data. |
Table of Contents
- ZenvestAI Quick Insight
- Key Takeaways
- At a Glance: Foundational Valuation Snapshot
- What Drives Altcoin Valuation and Price Action?
- Table of Contents
- Understanding Altcoin Valuation Principles
- How It Works: The Core Valuation Mechanics
- Components: Tokenomics and Supply Architecture
- Market Dynamics: How Liquidity and Order Books Drive Price Discovery
- Macro Drivers: Bitcoin Dominance and Capital Rotation Cycles
- Sentiment and Speculation: Derivatives, Funding, and Market Psychology
- Sector-Specific Valuation: From Layer-1s to Memecoins
- Analytical Framework: 10 Steps to Evaluate Any Altcoin
- Risks and Common Valuation Mistakes
- Worked Numerical Valuation Example: The Token Overhang Reality
- ZenvestAI Complete Analytical Checklist
- Frequently Asked Questions
- ZenvestAI View
- Related Intelligence
- 10 Best Quality Relevant Posts
- The Bottom Line
- Author and Editorial Information
- Global Regulatory Disclosures
What Drives Altcoin Valuation and Price Action?
Altcoin valuation is the analytical process of estimating the economic value of an alternative cryptocurrency relative to its circulating supply, utility, fee generation, adoption, and token design.
Market dynamics describe the continuous forces—including capital flows, order book depth, liquidity rotation from Bitcoin, derivatives positioning, and investor sentiment—that determine actual market prices on exchanges.
A low token price does not mean an altcoin is cheap, and a high market capitalization does not guarantee long-term protocol value. True economic worth requires comparing what a network produces in verifiable utility or revenue against the real supply available for trading today and in the future.
Understanding Altcoin Valuation Principles
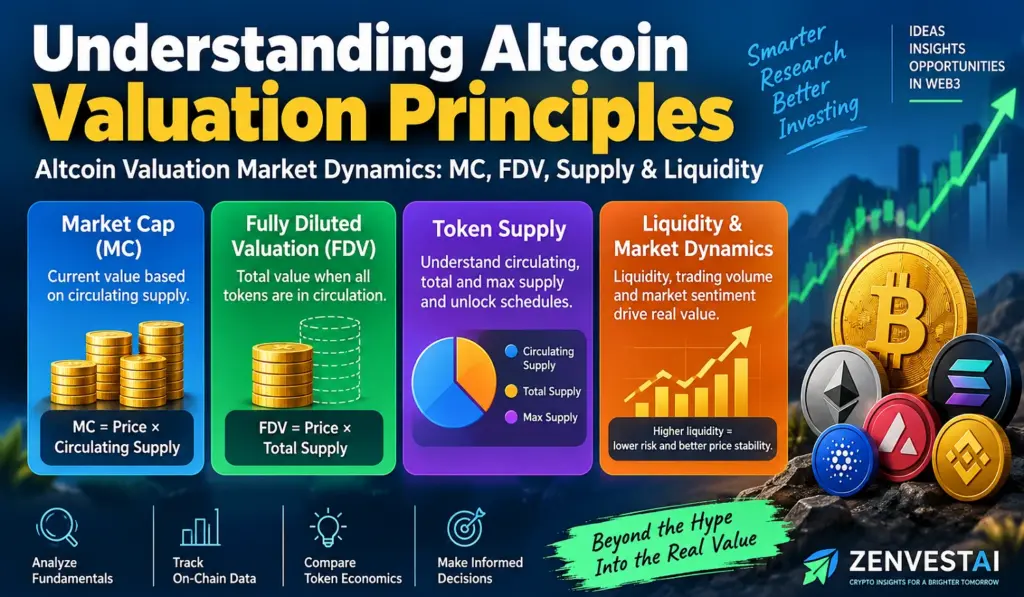
“Understanding Altcoin Valuation Principles” refers to the foundational knowledge and analytical framework required to assess what an alternative cryptocurrency (any crypto asset other than Bitcoin) is genuinely worth, rather than relying solely on speculative market hype or nominal unit price.
The Difference Between Token Price and Protocol Valuation
Evaluating an altcoin begins by distinguishing between its unit price and its aggregate valuation. A novice trader often assumes a token trading at $0.001 is a bargain with massive upside, while viewing an asset priced at $400 as expensive. This is a cognitive bias known as the unit bias.
Valuation is a function of price multiplied by available supply. If Token Alpha trades at $0.001 with a supply of 500 billion tokens, its market value stands at $500,000,000.
Conversely, if Token Beta trades at $400 with a total supply of only 200,000 units, its total valuation is $80,000,000. Token Beta is valued at less than a sixth of Token Alpha, despite its higher unit price.
Fundamental Valuation versus Speculative Market Value
Cryptocurrency assets experience a continuous tension between fundamental value and speculative pricing. Fundamental valuation attempts to anchor an asset to quantifiable economic realities, such as daily active users, gas consumed, settlement speed, protocol fee revenue, and treasury holdings.
Speculative market value represents what market participants are willing to pay right now based on expectations of future growth, attention narratives, or macro momentum.
In early-stage markets, speculative value regularly overshadows fundamental value for months at a time. However, when market-wide liquidity dries up, assets without underlying fee generation or sticky utility tend to suffer the steepest drawdowns.
Why Crypto Valuation Differs from Traditional Equity Valuation
Valuing a software token requires different mental models than valuing corporate shares. Equities grant shareholders legal ownership rights, dividend claims, voting power in board elections, and residual claims on corporate assets in bankruptcy proceedings.
Crypto tokens rarely convey corporate ownership. Holding a governance token generally offers only the right to vote on smart contract parameters or software upgrades.
Value accrual must therefore be engineered programmatically into the token’s smart contracts through buyback-and-burn mechanics, staking fee distributions, or utility requirements for network transactions.
Now that we understand the distinction between price, market value, and fundamental utility, what exact formulas do professional analysts use to measure these assets?
How It Works: The Core Valuation Mechanics
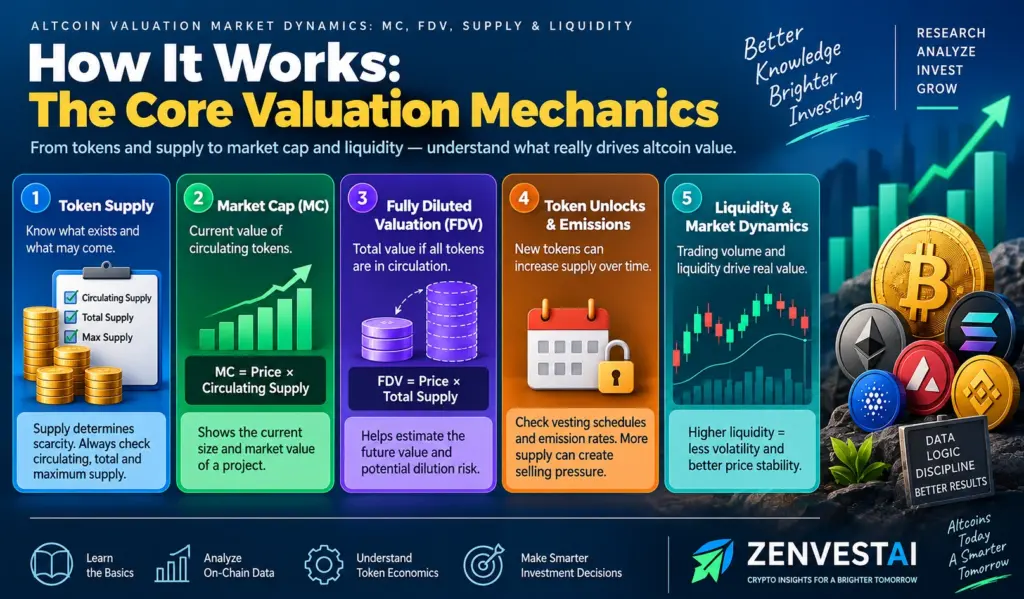
“This section breaks down the essential mathematical formulas and on-chain ratios analysts use to measure an altcoin’s true financial scale and dilution risk.”
Market Capitalization and Circulating Supply
Market capitalization serves as the starting baseline for comparing digital asset sizes across the market. The formula is straightforward:
Market Capitalization = Current Spot Price × Circulating SupplyCirculating supply represents the total number of tokens that are publicly available and moving in the market.
Platforms such as CoinGecko’s Methodology monitor verified public wallet addresses to exclude locked team allocations, private investor vesting pools, and long-term foundation reserves from this calculation.
A high market capitalization indicates that an asset has achieved broad distribution and substantial nominal scale.
However, market cap does not represent the actual amount of fiat cash deposited into a project; it simply reflects the price of the most recent transaction multiplied by all circulating units.
Fully Diluted Valuation (FDV) and the Supply Overhang
Fully Diluted Valuation projects what an altcoin’s total market value would be if every single token existed in the open market today:
Fully Diluted Valuation (FDV) = Current Spot Price × Maximum (or Total) Supply)The difference between circulating market cap and FDV reveals the scale of future token inflation.
If a project launches with a $100 million circulating market cap but has an FDV of $2 billion, 95% of its total token supply remains locked behind vesting schedules.
As these tokens unlock and enter circulation, market demand must expand by $1.9 billion merely to keep the spot price from falling.
Network Value to Transactions (NVT) Ratio
The Network Value to Transactions (NVT) ratio functions as the crypto ecosystem’s counterpart to the traditional Price-to-Earnings (P/E) ratio. First introduced by on-chain analysts, the metric evaluates the relationship between network valuation and daily economic throughput:
NVT Ratio = Market Capitalization ÷ Daily On-Chain Transaction Volume (in USD)A high NVT ratio suggests that market value is outpacing the actual utility and value transfer taking place on the blockchain, which can signal overvaluation.
A low NVT ratio indicates that the network is settling significant transactional value relative to its current market capitalization, as documented in analytical research by Glassnode’s NVT Ratio Guide.
Total Value Locked (TVL) and Capital Efficiency
Total Value Locked (TVL) crypto tracks the aggregate dollar value of all digital assets currently deposited into a blockchain’s or protocol’s smart contracts.
Platforms like DefiLlama’s Analytics track TVL across decentralized exchanges, lending markets, liquid staking pools, and bridge contracts.
Analysts frequently evaluate the Market Cap-to-TVL ratio or FDV-to-TVL ratio.
A ratio below 1.0 indicates that the protocol secures more external capital than its own token’s current market value, suggesting strong asset utility and user confidence.
However, analysts must verify whether that locked capital is organic or simply pursuing temporary, highly dilutive yield-farming subsidies.
MVRV Z-Score for Altcoins
The MVRV Z-Score altcoins framework compares an asset’s current spot market capitalization against its realized capitalization.
Realized capitalization values each unit of supply at the price it last moved on-chain, calculating the aggregate cost basis of all network participants:
MVRV Z-Score = (Market Cap − Realized Cap) ÷ Standard Deviation of Market CapWhen market capitalization rises significantly above realized capitalization, paper profits across the network reach historic extremes, frequently indicating market cycle peaks.
Conversely, when market cap drops well below realized capitalization, most holders are underwater, historically marking multi-year accumulation zones according to data verified by Glassnode’s MVRV Z-Score Metrics.
Knowing the primary financial metrics is essential, but what underlying architecture dictates how those supply numbers change over time?
Components: Tokenomics and Supply Architecture
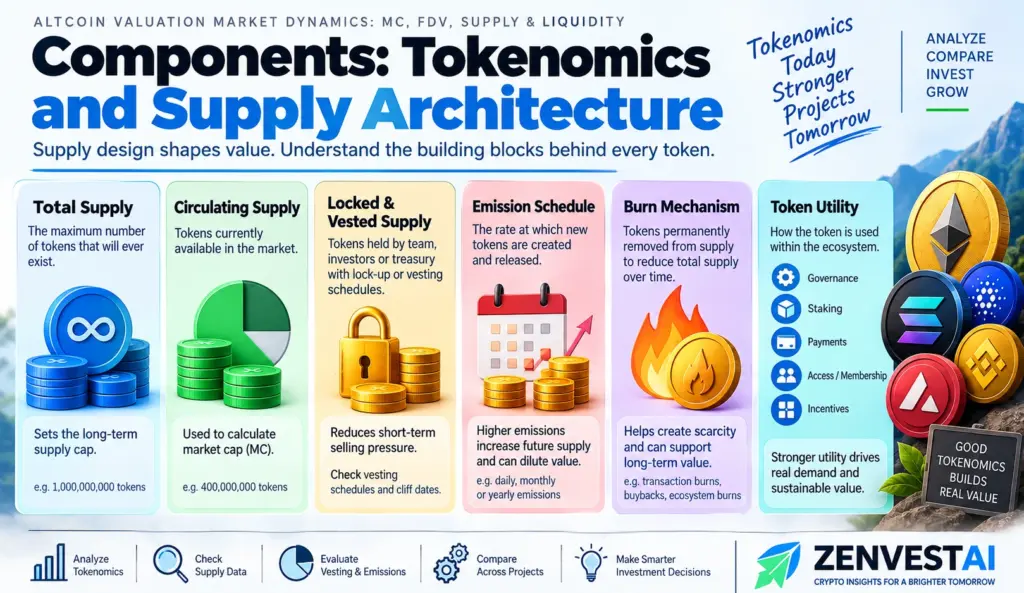
“Tokenomics and supply architecture define the mathematical rules, vesting schedules, and emission rates that govern how an altcoin’s available supply expands over time.”
Token Allocation and Initial Distribution
Tokenomics defines the rules, incentives, and economic schedule governing a cryptocurrency’s lifecycle.
An altcoin’s initial distribution profile heavily determines its long-term price behavior and decentralization profile.
Total Token Generation Event (TGE) Distribution:
├── Public Sale / Community Airdrop (Circulating Day 1)
├── Ecosystem Growth & Liquidity Incentives (Multi-Year Emissions)
├── Core Development Team & Founders (Vesting Cliff + Linear Unlock)
├── Early Strategic Investors / VCs (Discounted Basis + Strict Locks)
└── Foundation Treasury (Protocol Governance & Reserve Funds)
Projects that allocate 40% to 60% of their supply to private insiders with short cliff periods present severe structural risks to public buyers.
If initial circulating supply is restricted to 5% of total tokens, market makers can easily inflate spot prices due to artificial scarcity, creating an unsustainable valuation before early investors unlock their low-cost tokens.
Vesting Schedules and Cliff Dynamics
A vesting schedule governs when early contributors and private investors receive custody of their tokens.
A typical vesting design includes a “cliff”—a designated duration (often 12 months) during which no tokens are distributed—followed by linear monthly releases over two to four years.
Investors must closely track the calendar dates of these unlocks. When massive tranches of supply become liquid simultaneously, institutional recipients often sell a portion of their holdings to de-risk their initial capital, introducing sustained sell-side pressure on decentralized and centralized exchange order books.
Inflation, Deflation, and Protocol Fee Burns
A token’s circulating supply is rarely static; it expands through block rewards and contracts through programmatic burns.
Proof-of-Stake blockchains distribute newly minted tokens to validators to pay for consensus security, creating annual structural inflation that typically ranges between 2% and 8%.
To counteract this dilution, modern protocols implement fee-burning mechanisms. Under models similar to Ethereum’s EIP-1559, a portion of the base transaction fee paid by network users is permanently removed from circulation.
When network transaction volume is high, the burned amount can exceed newly minted validator rewards, transforming the asset into a deflationary currency.
Staking Yields: Gross Yield versus Net Real Reality
Protocol staking dashboards frequently display high annual percentage yields (APY) to attract token deposits. However, experienced analysts carefully distinguish between nominal yield and real yield.
If a protocol pays a 15% nominal staking APY while its overall token supply expands by 20% annually through emissions, stakers are losing 5% in purchasing power per year in real terms.
Non-stakers suffer even faster dilution. Sustainable value accrual occurs only when protocol staking rewards originate from genuine customer fees rather than programmatic token printing.
If supply mechanics set the baseline inventory, what market forces determine the daily prices at which buyers and sellers trade this inventory?
Market Dynamics: How Liquidity and Order Books Drive Price Discovery
Supply and Demand Mechanics on Modern Exchanges
Altcoin market dynamics describe the fluid processes through which buyers and sellers establish fair prices on public markets.
Price discovery occurs continuously across centralized exchanges (CEXs) utilizing limit order books and decentralized exchanges (DEXs) using automated market maker (AMM) formulas.
A sudden surge in buyer interest does not automatically translate to a proportional price increase. The resulting price move depends directly on the depth of the opposing sell orders waiting to absorb that capital.
Order Book Depth, Slippage, and Bid-Ask Spreads
The Order book depth crypto metric measures the total volume of buy and sell limit orders situated within a given percentage (such as ±2%) of the current spot price.
Deep order books allow traders to execute large transactions with minimal price deviation, known as slippage.
Order Book Depth Dynamics:

[Shallow Book] Large Buy Order ──> Consumes Thin Ask Wall ──> Massive Price Spike (High Slippage)
[Deep Book]    Large Buy Order ──> Absorbed by Heavy Asks   ──> Orderly Price Discovery (Low Slippage)
In low-liquidity altcoins, a modest market order of $50,000 can move the execution price by 10% or more.
High nominal market capitalizations in tokens with paper-thin order book depth create an illusion of stability that shatters under sudden selling pressure.
Automated Market Makers and Constant-Product Liquidity
Decentralized exchanges rely on mathematical formulas rather than matching order books to price tokens. The foundational AMM model uses the constant-product invariant formula:
x × y = kHere, x represents the reserve balance of Token A, y represents the reserve balance of Token B, and k is a fixed constant.
When a trader deposits Token B to purchase Token A, the pool’s inventory of Token A decreases, causing its relative price to climb along an exponential curve.
Liquidity providers in these pools face impermanent loss—the opportunity cost suffered when pool asset prices diverge compared to simply holding the tokens outside the smart contract.
Protocols that fail to compensate liquidity providers through organic trading fees face sudden liquidity migration, leaving token prices vulnerable to elevated volatility.
Exchange Inflows, Outflows, and Whale Movements
Tracking the flow of tokens between private wallets and centralized exchanges provides critical insight into near-term supply pressure.
Exchange inflows and outflows reflect macro investor intent. Sustained net outflows indicate that investors are transferring assets into cold storage or DeFi protocols for long-term holding.
Conversely, large spikes in exchange inflows suggest that major holders or venture investors are preparing to sell.
Analysts set up whale wallet tracking alerts on tools like Arkham and Etherscan to monitor large, concentrated token balances, watching for sudden deposits onto exchange trading desks before prices react.
While individual token liquidity governs local price movement, broad crypto market trends remain deeply tied to the industry’s primary benchmark asset: Bitcoin.
Macro Drivers: Bitcoin Dominance and Capital Rotation Cycles
The Bitcoin Gravity Well and Market Correlation
Bitcoin operates as the reserve currency and primary liquidity gateway of the digital asset ecosystem. The Crypto market correlation coefficient measures how closely altcoin price trajectories mirror Bitcoin’s market movements.
During macro risk-off environments or sharp market contractions, this correlation frequently spikes toward 1.0, meaning almost all altcoins drop in tandem regardless of individual fundamentals.
When Bitcoin drops sharply, altcoins typically fall two to three times harder due to lower liquidity and higher systemic beta. Understanding an altcoin’s standalone potential requires first analyzing the broader Bitcoin macro environment.
The Dynamics of Bitcoin Dominance
Bitcoin Dominance (BTC.D) measures Bitcoin’s share of the total cryptocurrency market capitalization:
Bitcoin Dominance (%) = (Bitcoin Market Cap ÷ Total Crypto Market Cap) × 100Rising Bitcoin dominance signals risk-averse market conditions, where capital consolidates into Bitcoin for safety.
Declining dominance, particularly when total market capitalization is growing, indicates expanding investor confidence and speculative appetite for smaller, higher-beta assets.
The Capital Rotation Waterfall
Historically, liquidity does not enter all corners of the market simultaneously. Instead, capital flows through a recognizable multi-stage waterfall sequence:
Stage 1: Bitcoin Expansion

Fiat & Institutional ETF Capital ──> Drives Bitcoin to New Highs
                │
                ▼
Stage 2: Large-Cap Rotation

Profits Rotate ──> Ethereum & Major Layer-1 Foundations
                │
                ▼
Stage 3: Mid-Cap Expansion

Liquidity Spreads ──> High-Volume DeFi Protocols, L2s, & Sector Leaders
                │
                ▼
Stage 4: Broad Altcoin Season

Peak Speculation ──> Small Caps, Micro Caps, & Memecoins
The Altcoin season index tracks this rotation by measuring whether at least 75% of the top 50 altcoins have outperformed Bitcoin over a rolling 90-day window.
If Bitcoin consolidates while capital spreads across the broader market, an altcoin season unfolds.
However, these rotations are cyclical tendencies rather than guaranteed mechanical rules, and macro economic liquidity shifts can truncate the sequence at any point.
Stablecoin Dominance as Dry Powder
The Stablecoin dominance chart tracks the percentage of total market value held in dollar-pegged digital assets such as USDT and USDC.
A rising stablecoin dominance ratio signals caution, showing that market participants have exited volatile tokens to sit in digital cash.
High stable coin dominance represents sidelined capital ("dry powder"). When market sentiment stabilizes, this capital can rapidly rotate back into altcoins without requiring fresh banking system inflows.
Beyond macroeconomic flows and technical order book mechanics, what role do human psychology and derivatives play in pricing altcoins?
Sentiment and Speculation: Derivatives, Funding, and Market Psychology
Perpetual Swaps, Funding Rates, and Open Interest
In modern crypto markets, derivatives volume regularly dwarfs spot trading volume. Perpetual swap contracts—futures agreements without an expiration date—use a periodic funding mechanism to keep contract prices anchored to the underlying spot index.
The Funding rates perpetual swaps metric measures the cost of holding leveraged positions:
- Positive Funding Rates: Long traders pay short traders. This indicates bullish positioning, showing that traders are willing to pay a premium to maintain long leverage.
- Negative Funding Rates: Short traders pay long traders. This indicates bearish sentiment, showing that the majority of leveraged traders anticipate further price declines.
When funding rates reach extreme positive levels while open interest (the total value of unsettled derivative contracts) hits record highs, the market becomes vulnerable to a "long squeeze."
A small dip in spot price can trigger automated liquidations of leveraged longs, creating a cascading wave of forced selling that collapses valuations within minutes.
The Crypto Fear and Greed Index and Reflexivity
The Crypto Fear and Greed Index aggregates market volatility, momentum, social volume, and survey data into a unified sentiment score ranging from 0 (Extreme Fear) to 100 (Extreme Greed).
George Soros's Concept of Reflexivity Applied to Crypto:

Rising Price ──> Bullish Social Hype ──> More Capital Enters ──> Fundamentals Improve (TVL Rises)
      ▲                                                                     │
      └──────────────────────── Expands Valuation ──────────────────────────┘
Reflexivity describes how market prices actively influence the fundamentals they are supposed to merely reflect.
As an altcoin’s price rises, developers are attracted to the ecosystem, partnerships materialize, and the protocol treasury swells in value, temporarily creating the fundamental progress that validates the higher valuation.
When prices fall, the reverse cycle can drain capital, developers, and liquidity with equal speed.
Social Volume Analytics and Narrative Premiums
The Social volume crypto analytics metric monitors the frequency of keyword mentions across platforms like X (Twitter), Discord, Telegram, and Reddit.
Spikes in retail social discussion frequently coincide with local valuation peaks, marking the point where smart-money investors use exit liquidity to sell into retail enthusiasm.
A "narrative premium" occurs when a project belongs to an industry sector capturing broad market imagination—such as Artificial Intelligence (AI), Decentralized Physical Infrastructure Networks (DePIN), or Real World Assets (RWA).
An altcoin aligned with a dominant narrative can trade at five to ten times the valuation of an identical protocol operating in an out-of-favor sector.
How do these broad market dynamics apply when evaluating specific sectors across the cryptocurrency landscape?
Sector-Specific Valuation: From Layer-1s to Memecoins
Valuation frameworks cannot be applied uniformly across all cryptocurrencies. Valuing a base settlement blockchain requires different analytical tools than valuing a decentralized lending market or a community memecoin.
Layer-1 and Layer-2 Blockchains
Base settlement networks (Layer-1s like Ethereum, Solana, and Avalanche) and execution scaling rollups (Layer-2s like Arbitrum, Optimism, and Base) act as digital sovereign economies.
- Key Valuation Metrics: Daily active addresses, transaction throughput (TPS), transaction fee revenue, validator count, total economic security (cost to 51% attack), and ecosystem developer activity.
- Core Valuation Question: Does the network generate sufficient transaction fees to pay for long-term validator security without needing perpetual high token inflation?
Decentralized Finance (DeFi) Protocols
DeFi platforms encompass decentralized exchanges (Uniswap), lending markets (Aave), and liquid staking derivatives (Lido).
Because these platforms operate financial smart contracts, their economic activity closely resembles traditional fintech businesses.
- Key Valuation Metrics: Total Value Locked (TVL), annualized protocol fees, retained protocol revenue, daily trading volume, and price-to-sales (P/S) multiples tracked on Token Terminal’s Revenue Metrics.
- Core Valuation Question: What percentage of protocol fees accrues directly to token holders through buybacks, burns, or fee-sharing, versus being redirected to liquidity providers?
DePIN and Real-World Assets (RWA)
Decentralized Physical Infrastructure Networks (DePIN) incentivize hardware deployment (such as wireless hotspots, distributed compute, or mapping), while RWA platforms bring tokenized US Treasuries, private credit, and real estate on-chain.
- Key Valuation Metrics: Verified physical node count, hardware utilization rates, real dollar revenue generated from external customers, and total off-chain collateral under custody.
- Core Valuation Question: Are customers paying real fiat or stablecoins for the underlying physical service, or is the network running entirely on circular token subsidies?
Governance Tokens and DAOs
Governance tokens grant voting rights over decentralized autonomous organization (DAO) treasuries and parameter updates.
- Key Valuation Metrics: Treasury balance, liquid runway (in years), voter participation rate, and legal governance defense structures.
- Core Valuation Question: Can token holders legally or programmatically access treasury capital, or is the token’s governance authority purely advisory?
Memecoins: The Attention Economy Model
Memecoins lack traditional cash flows, protocol utility, or balance sheets. Applying discounted cash flow models or NVT ratios to memecoins fails because their price discovery is driven purely by cultural alignment, social coordination, and attention capture.
- Key Valuation Metrics: Unique holder count, social media growth rate, decentralized exchange liquidity-to-market-cap ratio, and top-10 holder supply concentration.
- Core Valuation Question: Is the coin’s social momentum expanding organically across new communities, or is a small group of early deployers holding the majority of supply waiting to sell?
Translating these sector nuances into actionable evaluation requires a disciplined, step-by-step process.
Analytical Framework: 10 Steps to Evaluate Any Altcoin
Step 1: Utility Audit ──────────> Identify why anyone needs to hold the token.
Step 2: Supply Verification ────> Compare circulating supply against maximum supply.
Step 3: FDV Overhang Test ──────> Calculate the market cap-to-FDV ratio.
Step 4: Unlock Calendar Map ────> Chart insider release dates for the next 24 months.
Step 5: On-Chain Adoption ──────> Verify daily active users and real transaction volume.
Step 6: Economic Value Capture ─> Measure protocol fees and token cash-flow linkage.
Step 7: Liquidity Stress-Test ──> Check order book depth and DEX pool durability.
Step 8: Competitor Benchmarking ─> Compare relative multiples (P/S, TVL) to market rivals.
Step 9: Macro Alignment ────────> Assess current Bitcoin dominance and sector momentum.
Step 10: Worst-Case Modeling ───> Simulate a 70% sector drawdown to test liquidation risk.- Conduct a Token Utility Audit: Clarify the exact programmatic purpose of the token. Does using the platform require paying with the token, staking it for work, or using it to govern parameters? If the token can be removed without breaking the protocol, its long-term economic demand is fundamentally weak.
- Verify Circulating and Maximum Supply: Inspect raw blockchain contract data to confirm the true supply. Check whether the token has an immutable supply cap or an unconstrained mint function controlled by a developer multi-signature wallet.
- Execute the Market Cap to FDV Overhang Test: Divide circulating market cap by FDV. If the resulting ratio is under 0.20 (meaning less than 20% of tokens are in circulation), proceed with caution; the asset faces heavy multi-year supply headwinds.
- Map the 24-Month Unlock Calendar: Review the project’s documentation and tracking platforms to map exact monthly unlock volumes. Compare upcoming monthly releases against current daily trading volume to gauge market absorption capacity.
- Inspect Real On-Chain Activity: Filter out automated bot transactions by reviewing daily active addresses and smart contract interactions on public block explorers. High transaction counts with low unique wallet participation often indicate wash trading.
- Quantify Protocol Revenue and Value Capture: Review analytical data on platforms like DefiLlama’s Protocol Revenue Rankings to separate total gross fees from actual retained protocol revenue. Determine whether that revenue benefits token holders via burns, distributions, or treasury growth.
- Stress-Test Order Book Depth and Liquidity: Review 2% market depth across major spot exchanges. Verify whether the token’s decentralized liquidity pool contracts are permanently burned or locked in time-release contracts.
- Benchmark Against Direct Competitors: Compare the altcoin’s valuation multiples against established competitors in the same sector. If a new decentralized exchange trades at three times the FDV-to-volume ratio of Uniswap, its valuation likely carries an unjustified speculative premium.
- Assess Macro and Narrative Alignment: Check where the market sits within the broader cycle. Is Bitcoin dominance rising or falling? Is the asset’s primary sector enjoying strong social attention, or is capital rotating elsewhere?
- Model Downside Scenarios: Run a stress test simulating an immediate 50% decline in Bitcoin’s price and a 70% decline in the altcoin’s primary liquidity pools. Identify where major protocol loan liquidations occur and whether staking yields can survive lower asset prices.
What are the most common analytical errors investors make when evaluating these steps in practice?
Risks and Common Valuation Mistakes
- Falling for Nominal Unit Bias: Believing a $0.01 token can easily hit $10 without calculating that this would require a $10 trillion market capitalization—more than the market value of Apple, Microsoft, and Google combined.
- Treating FDV as Irrelevant: Assuming locked tokens do not affect current prices. When early investors receive newly unlocked tokens, their desire to realize profits introduces steady, structural market selling pressure.
- Confusing Protocol Success with Token Accrual: Investing in a wildly successful application whose developers capture profits at the corporate level or distribute protocol fees exclusively to liquidity providers, leaving the governance token economically detached from platform growth.
- Relying on Gross Yield Instead of Net Yield: Staking into an 80% APY farm without accounting for a 90% decline in the underlying token’s price caused by hyperinflationary emissions.
- Ignoring Liquidity Pool Quality: Looking only at total TVL without noticing that 80% of the locked assets consist of the project’s own native, illiquid token rather than stablecoins, Bitcoin, or Ethereum.
- Assuming Historic Multiples Are Permanent: Assuming an altcoin that reached a $5 billion market cap during a previous cycle will automatically reclaim that valuation, ignoring intervening dilution that quadrupled its circulating supply.
Let us walk through a practical mathematical example to see how supply overhang alters real-world valuation.
Worked Numerical Valuation Example: The Token Overhang Reality
Consider an actual analytical scenario evaluating a hypothetical asset, Protocol Nexa (NEXA):
- Current Spot Price: $2.00
- Current Circulating Supply: 50,000,000 NEXA
- Maximum Total Supply: 1,000,000,000 NEXA
The Preliminary Calculation
Circulating Market Capitalization = $2.00 × 50,000,000 = $100,000,000 ($100 Million)
Fully Diluted Valuation (FDV)      = $2.00 × 1,000,000,000 = $2,000,000,000 ($2 Billion)
Circulating Supply Ratio          = 50,000,000 ÷ 1,000,000,000 = 5.0%
Supply Overhang                   = Total Supply − Circulating = 950,000,000 NEXA ($1.9 Billion at current spot)
The Analytical Interpretation
At first glance, NEXA appears moderately valued as a mid-cap altcoin with a $100 million market cap. However, only 5% of its tokens are circulating.
The remaining 950 million tokens ($1.9 billion in nominal value at current prices) will unlock over the next 36 months according to its vesting schedule.
To maintain its current $2.00 price point when the full supply unlocks, the protocol’s market capitalization must grow from $100 million to $2 billion.
If total network adoption and capital inflows remain constant, the spot price must drop by 95%—down to $0.10 per token—once all units enter circulation:
Equilibrium Price with Zero New Capital = Current Market Cap ÷ Max Supply
                                        = $100,000,000 ÷ 1,000,000,000 = $0.10
This numerical demonstration proves why an altcoin with strong technological features can suffer continuous price depreciation throughout a multi-year vesting schedule.
To keep these analytical steps accessible whenever you review an asset, use this quick reference checklist.
ZenvestAI Complete Analytical Checklist
Use this structured framework to systematically audit any altcoin before making capital decisions:
Core Valuation Metrics
- [ ] Current Spot Price verified on multi-exchange price aggregators.
- [ ] Verified Circulating Supply checked on public block explorers.
- [ ] Maximum Supply and Minting Permissions checked in smart contracts.
- [ ] Current Market Cap calculated (Price × Circulating).
- [ ] Fully Diluted Valuation calculated (Price × Maximum Supply).
- [ ] Circulating-to-FDV Ratio scored (Greater than 0.50 preferred).
Tokenomics and Supply Schedule
- [ ] Initial allocation audit complete (Insiders vs Community).
- [ ] Private investor seed round purchase prices identified.
- [ ] Vesting cliff and linear unlock calendar mapped for 24 months.
- [ ] Annual inflation rate from staking rewards or mining calculated.
- [ ] On-chain token burn or buyback mechanics verified.
Protocol Health and Fundamentals
- [ ] Daily Active Addresses (excluding smart contract automation).
- [ ] Daily On-Chain Transaction Volume (USD-adjusted).
- [ ] Total Value Locked (excluding native protocol tokens).
- [ ] 30-Day Cumulative Protocol Fees vs Protocol Revenue.
- [ ] Active developers contributing verified code to public GitHub repositories.
Market Structure and Liquidity
- [ ] 2% Market Depth on top centralized exchanges evaluated.
- [ ] Decentralized Exchange Liquidity Pool lock status verified.
- [ ] 30-Day Average Daily Trading Volume vs Circulating Cap.
- [ ] Perpetual swap funding rates and open interest levels monitored.
- [ ] Exchange net inflows/outflows tracked over the past 14 days.
Below are concise, direct answers to the most common questions surrounding altcoin valuation and market dynamics.
Frequently Asked Questions
What is altcoin valuation?
Altcoin valuation is the analytical process of estimating a cryptocurrency’s economic value relative to its circulating supply, utility, fee generation, adoption, and tokenomics design.
It aims to determine whether an asset is priced reasonably relative to its actual and potential economic activity.
How do you value an altcoin?
You value an altcoin by examining its circulating market capitalization, fully diluted valuation (FDV), token distribution, on-chain user activity, revenue generation, and competitive positioning.
This involves checking whether the platform creates sustainable real-world utility and whether the token’s design captures that economic value.
What is the difference between altcoin price and market cap?
A token’s price is simply the exchange rate for a single unit of the asset, while market capitalization represents the total dollar value of all circulating units combined (Price × Circulating Supply).
An asset with a low unit price can have a far higher market valuation than an asset with a high unit price if its supply is substantially larger.
What is FDV in crypto and why is it important?
Fully Diluted Valuation (FDV) is the hypothetical market capitalization of a project if its entire maximum token supply were unlocked and trading at the current market price.
It is critical because it reveals future dilution risk; a large gap between market cap and FDV indicates substantial upcoming token unlocks that could dilute existing holders.
Is a low-priced altcoin cheap?
No. A low token price does not mean an altcoin is cheap. Price must always be evaluated alongside circulating supply.
A token priced at $0.0001 with 100 trillion units has an aggressive $10 billion market valuation, making it far more expensive than a $50 token with only 100,000 units in existence ($5 million market cap).
How do token unlocks affect altcoin valuation?
Token unlocks increase the circulating supply of an altcoin by releasing previously locked tokens to founders, team members, or early investors.
If market demand does not expand at the same rate as the newly unlocked supply, the increased sell pressure will drive the spot market price down.
What makes an altcoin increase in value?
An altcoin increases in value when organic buying demand exceeds available sell-side market liquidity.
Sustainable long-term appreciation is driven by expanding user adoption, network fee growth, programmatic supply burns, increased staking demand, and constructive macro liquidity conditions.
How does Bitcoin affect altcoin prices?
Bitcoin acts as the crypto market’s primary liquidity base and sentiment benchmark. When Bitcoin experiences high volatility or macro downtrends, altcoins typically drop more severely due to thinner liquidity and higher risk profiles.
When Bitcoin consolidates after a sustained rally, capital often rotates into altcoins in search of higher returns.
Can an altcoin be overvalued despite strong adoption?
Yes. A decentralized protocol can achieve high transaction volumes and widespread user adoption while its token remains overvalued.
If the token captures no network fees, confers only superficial governance rights, or suffers from hyperinflationary emissions, the token’s market price can drop even as protocol usage grows.
ZenvestAI View
The cryptocurrency market is transitioning from an era of purely speculative attention to an era of disciplined fundamental evaluation.
For over a decade, simple narrative momentum and low-float supply manipulation allowed poorly structured projects to command multi-billion-dollar valuations.
As global regulatory frameworks clarify and institutional capital expands its presence, market participants increasingly reward verifiable utility, sustainable cash flows, and transparent tokenomics.
Investors who rely solely on social media hype or nominal unit bias will face compounding dilution. Sustainable outperformance belongs to those who evaluate altcoins as programmable economic systems, carefully auditing every supply unlock, liquidity pool, and revenue mechanism.
Related Intelligence
- Understanding Impermanent Loss in Automated Market Makers
- Governance Tokens and DAO Treasury Mechanics
- Evaluating Proof-of-Stake Validator Economics and Real Yield
- On-Chain Liquidity: Reading Limit Order Books and AMM Pools
10 Best Quality Relevant Posts
- Understanding Tokenization and Wholesale Digital Assets in 2026
- The Future of Cryptocurrency in 2026
- The Ultimate Risk-to-Reward Ratio Guide: Master Crypto Risk and Protect Your Capital
- Oracle Risk in DeFi: How Price Oracles Fail, Their Risks and How to Secure Them
- What Is Cryptoeconomic Security? Complete Guide to Blockchain Economic Security
- How Distributed Ledgers Are Radically Rewriting the Rules of Modern Finance
- Collateral: The Foundation of Crypto Financing
- What Is Web3? A Complete Guide to the Decentralized Internet
- What Is Crypto Staking? The Complete Guide to Earning Rewards Safely
- India Crypto Market 2026: New Regulations, 30% Tax Rules, and Market Outlook
The Bottom Line
An altcoin’s true worth is defined by the sustainable economic value its network captures, weighed against the full volume of supply that will ever enter circulation.
Author and Editorial Information
- Written by: ZenvestAI Crypto Research & Market Intelligence Team
- Editorial Review: Deepak Kumar, Senior Financial Analyst & Digital Asset Strategist
- Methodology: Every analytical metric referenced is cross-verified against live on-chain smart contract data, public exchange order books, and verified tracking platforms including CoinGecko, DefiLlama, and Token Terminal. All financial formulas conform to standard quantitative asset pricing models adapted for decentralized networks.
Global Regulatory Disclosures
This research and educational material is prepared exclusively for informational purposes in compliance with global standards established by the International Organization of Securities Commissions (IOSCO Policy Recommendations for Crypto and Digital Asset Markets), the European Securities and Markets Authority (ESMA Markets in Crypto-Assets Regulation – MiCA), and relevant regulatory guidance from the US Securities and Exchange Commission (SEC).
Nothing contained in this publication constitutes financial, legal, investment, or tax advice. Digital assets and alternative cryptocurrencies are subject to extreme market volatility, smart contract vulnerabilities, structural illiquidity, and total risk of capital loss. Readers must conduct independent due diligence and consult licensed financial advisors before committing capital to digital asset markets.
Data Sources & Referenced Documentation
- CoinGecko Market Capitalization & Supply Methodology — Framework for circulating supply verification and market cap tiering.
- DefiLlama Protocol Analytics — Multi-chain Total Value Locked (TVL) tracking and on-chain protocol fee rankings.
- Token Terminal Protocol Financial Statements — Standardized revenue, fee retention, and P/S multiples for decentralized protocols.
- Glassnode On-Chain Intelligence Guides — Mathematical definitions for Network Value to Transactions (NVT) and MVRV Z-Score metrics.
- ESMA MiCA Regulatory Documentation — European regulatory framework for digital asset transparency, classification, and consumer protection.
ZenvestAI Research Framework
ZenvestAI Proprietary Research Frameworks & Insights
ZenvestAI extends conventional tokenomics analysis by examining not only market capitalization, fully diluted valuation (FDV), circulating supply, and scheduled unlocks, but also the market’s capacity to absorb newly circulating supply and the persistence and structural quality of liquidity supporting a protocol.
These analytical concepts form part of the broader ZenvestAI Token Economic Resilience Framework , which evaluates token economic resilience across four related dimensions: Supply Pressure, Economic Absorption, Liquidity Quality, and Market Regime.
How This Research Framework Fits Into ZenvestAI’s Broader Methodology
Conventional tokenomics analysis often focuses on market capitalization, fully diluted valuation, circulating supply, token emissions and unlock schedules. These measures are useful, but they do not necessarily explain how efficiently a protocol can absorb additional token supply or how persistent its underlying liquidity may be.
The ZenvestAI Token Economic Resilience Framework therefore evaluates four complementary dimensions:
| Dimension | Primary Research Question | Relevant Factors |
|---|---|---|
| Supply Pressure | How much new token supply is entering or expected to enter the economic system? | Unlocks, emissions, inflation, vesting and circulating-supply expansion. |
| Economic Absorption | What mechanisms can economically absorb or offset additional token supply? | Burns, verified buybacks, economically attributable demand and other measurable absorption mechanisms. |
| Liquidity Quality | How persistent and structurally embedded is the capital supporting the protocol? | TVL composition, incentive dependency, protocol-owned liquidity, operational collateral and capital persistence. |
| Market Regime | What broader market conditions may influence the behavior of supply and liquidity? | Bitcoin conditions, volatility, funding, market liquidity and broader risk appetite. |
The two principal ZenvestAI research measures discussed below, FVBM and SLSI, primarily address the relationship between supply expansion, economic absorption and liquidity quality. They should be interpreted within the broader market-regime context rather than as isolated predictive signals.
For the complete methodology, definitions and research architecture, see: Token Economic Resilience Framework .
1. Float-to-Volume Burn Multiplier (FVBM)
The Float-to-Volume Burn Multiplier (FVBM) is a ZenvestAI analytical framework designed to compare projected token supply entering circulation with economically attributable token absorption capacity.
The objective is not simply to determine whether a token has a large unlock. Instead, FVBM asks whether scheduled supply expansion is large relative to identifiable mechanisms capable of absorbing or offsetting that expansion.
Conceptual Formula
FVBM90 = Projected 90-Day Unlock Value ÷ Projected 90-Day Organic Token Absorption
The 90-day window is an analytical starting point rather than a universal rule. Depending on the asset’s vesting structure, liquidity profile and market conditions, a 30-day, 180-day or 365-day observation window may provide a more appropriate analytical horizon.
Component A — Projected Token Unlock Value
Projected unlock value should be calculated from identifiable vesting and release schedules rather than relying exclusively on generic tokenomics summaries.
Unlock Value = Tokens Scheduled for Release × Reference Price
Where appropriate, research should distinguish between team allocations, investor allocations, ecosystem distributions, treasury releases, staking emissions and other supply events.
Component B — Organic Token Absorption
This is an important methodological distinction: protocol revenue and token absorption are not synonymous.
| Economic Mechanism | Potential Absorption Relevance | Research Treatment |
|---|---|---|
| Permanent Token Burn | Direct supply reduction | Potentially high |
| Verified Token Buyback | Potential market demand | Requires verification |
| Protocol Fees | Evidence of economic activity | Not automatically token demand |
| Staking Demand | Can reduce liquid float | Requires economic-context analysis |
| Treasury Purchases | Potential demand | Depends on funding source and execution |
| Speculative Demand | Market demand | Generally excluded from “organic” absorption |
Why FVBM Matters
A token can have a relatively modest circulating market capitalization while facing substantial future supply expansion. Conversely, a protocol with meaningful economic activity and verifiable absorption mechanisms may possess greater capacity to offset a portion of that expansion.
FVBM therefore adds another analytical layer to the conventional:
Market Cap → FDV → Circulating Supply → Unlock Schedule
It encourages analysts to ask:
- How much new supply is scheduled to enter circulation?
- How quickly is that supply expected to arrive?
- What economically attributable absorption mechanisms exist?
- Are those mechanisms recurring, verifiable and sustainable?
- How deep is the available market liquidity?
- What broader market regime is the asset operating within?
FVBM Should Not Be Used in Isolation
A token unlock is not automatically a sell order. Similarly, protocol fees are not automatically token demand.
The market impact of an unlock can vary depending on recipient behavior, exchange liquidity, market-maker activity, treasury management, demand growth, staking participation, derivatives positioning and broader market conditions.
FVBM should therefore be treated as a supply-pressure and absorption-capacity measure, rather than a deterministic price-prediction model.
2. Smart Contract Liquidity Stickiness Index (SLSI)
The Smart Contract Liquidity Stickiness Index (SLSI) is a ZenvestAI analytical framework designed to estimate the persistence and structural quality of protocol liquidity beyond headline TVL.
Total value locked measures capital deposited into a protocol, but it does not necessarily explain why the capital is there or how likely it is to remain.
Two protocols can each report the same amount of TVL while having substantially different liquidity structures.
Liquidity Classification
| Liquidity Category | Characteristics | Indicative Persistence |
|---|---|---|
| Mercenary TVL | High-yield farming capital, short-duration liquidity, temporary emissions and capital attracted primarily by incentives. | Low |
| Temporary LP Capital | Liquidity that may be sensitive to yield changes or competing opportunities. | Low to Moderate |
| Productive Collateral | Capital required to support borrowing, lending or other economic functions. | Moderate to High |
| Protocol-Owned Liquidity | Liquidity controlled or owned by the protocol itself. | High |
| Operationally Required Capital | Capital whose removal could impair important protocol functionality. | Potentially Very High |
Conceptual Formula
SLSI = (Weighted Persistent TVL ÷ Total TVL) × 100
The weighting system should be documented, versioned and empirically reviewed. SLSI should not be presented as an industry-standard scoring system unless independent evidence establishes such a standard.
Mercenary TVL
Mercenary TVL refers to liquidity that may be highly dependent on temporary incentives, token emissions, unusually high yields or short-duration opportunities.
- High-yield farming capital
- Short-duration liquidity
- Capital attracted by temporary emissions
- Liquidity displaying rapid withdrawal behavior following incentive changes
Sticky Operational TVL
Sticky Operational TVL refers to capital that is more closely associated with persistent protocol functions or structural ecosystem requirements.
- Protocol-owned liquidity
- Required collateral
- Operational treasury liquidity
- Capital supporting persistent protocol activity
- Liquidity associated with ongoing application functionality
Why Liquidity Stickiness Matters
During periods of market stress, capital that depends heavily on temporary incentives may be more sensitive to reductions in rewards, changes in yields or shifts in risk-adjusted returns.
More persistent liquidity can provide a different form of structural support for protocol activity, although persistence should never be interpreted as a guarantee of token-price stability.
SLSI therefore provides an additional lens for evaluating liquidity durability and structural quality.
SLSI Should Not Be Used as a Price-Floor Model
A high SLSI should not be interpreted as proof of future token-price support. It is an estimate of liquidity persistence and structural quality, not a guaranteed price-floor mechanism.
3. FVBM and SLSI Work Best Together
Supply pressure and liquidity quality are different variables. Their combination can provide a richer analytical picture than either measure alone.
| FVBM | SLSI | Analytical Interpretation |
|---|---|---|
| Low | High | Relatively limited scheduled supply pressure combined with comparatively durable liquidity. Other protocol and market risks still require evaluation. |
| High | High | Durable liquidity may coexist with substantial incoming token supply. The key research question becomes whether demand and absorption can accommodate the scheduled expansion. |
| Low | Low | Limited scheduled supply pressure does not eliminate liquidity risk. Capital may remain sensitive to incentives, market conditions or changes in protocol activity. |
| High | Low | Substantial scheduled supply expansion coinciding with comparatively fragile liquidity can warrant heightened analytical attention. |
These combinations are analytical configurations, not investment ratings or trading signals. Their interpretation must account for the underlying data, protocol architecture and prevailing market regime.
4. How These Frameworks Complement Traditional Tokenomics
Traditional analysis frequently begins with:
Market Cap → FDV → Circulating Supply → Unlock Schedule
ZenvestAI’s framework adds two further questions:
How large is future token supply relative to the protocol’s economically attributable absorption capacity?
How persistent and structurally embedded is the liquidity supporting the protocol?
This allows researchers to examine the interaction between:
- future circulating-supply expansion,
- economic absorption capacity,
- incentive-dependent liquidity,
- protocol-owned liquidity,
- organic economic activity,
- market liquidity depth, and
- broader market-regime conditions.
5. ZenvestAI Research Methodology
The credibility of a proprietary research framework depends on the transparency of its construction, data sources, assumptions and validation process.
Step 1 — Define the Research Question
Each metric should answer a specific economic question before its formula, weighting system or threshold is selected.
Step 2 — Identify Primary Data
Where available, ZenvestAI research should prioritize verifiable blockchain data, vesting contracts, governance records, protocol documentation and other primary sources.
Step 3 — Classify the Data
Observed data should be distinguished from estimates, assumptions and ZenvestAI-derived variables.
Step 4 — Calculate the Metric
Calculations should follow a documented and reproducible methodology, with the observation period and relevant assumptions disclosed where appropriate.
Step 5 — Evaluate Context
Results should be interpreted alongside protocol fundamentals, token distribution, liquidity depth, market structure and broader market conditions.
Step 6 — Review and Update
Proprietary research frameworks should remain subject to revision as empirical evidence, blockchain data quality, protocol designs and market structures evolve.
6. ZenvestAI Proprietary Insight: Supply Absorption
One of the central insights behind the ZenvestAI framework is that token unlocks and token absorption should be analyzed together.
A scheduled unlock represents potential additional circulating supply. It does not automatically represent an equivalent amount of sell pressure. The eventual market effect depends on how recipients behave, how much liquidity is available and whether organic demand can absorb the additional supply.
Similarly, protocol fees demonstrate economic activity but do not automatically create demand for the protocol’s native token.
ZenvestAI therefore separates:
- Supply expansion
- Economic activity
- Token absorption
- Market liquidity
- Demand conditions
This distinction is essential when evaluating whether a token’s future supply expansion represents a meaningful economic pressure or simply a scheduled change in circulating supply.
7. ZenvestAI Proprietary Insight: Liquidity Quality Matters More Than Headline TVL
TVL is an important DeFi metric, but headline TVL does not reveal the complete structure of deposited capital.
A more detailed analysis should consider:
- who controls the liquidity,
- why the liquidity is deposited,
- how dependent it is on incentives,
- whether it is required for protocol functionality,
- how long the capital tends to remain deposited,
- how concentrated the liquidity is, and
- how liquidity behaves when market conditions deteriorate.
This is the analytical rationale behind SLSI: the objective is not simply to measure how much capital is present, but to investigate what type of capital it is and how persistent it may be.
8. Research Qualification & Methodological Note
FVBM and SLSI are ZenvestAI analytical constructs designed to organize and evaluate tokenomics, protocol economics and DeFi liquidity data.
They should not be presented as universally accepted financial, valuation, solvency or risk models.
Their interpretation depends on the quality, completeness, frequency and methodology of the underlying data. Protocol-specific differences in token burns, unlock mechanisms, liquidity accounting, treasury structures, incentive programs and on-chain activity can materially affect results.
Thresholds, classifications and empirical relationships should be evaluated against the relevant dataset, measurement period, sample characteristics and validation methodology.
For the complete methodology and framework architecture, readers should consult the dedicated ZenvestAI Token Economic Resilience Framework .
9. Why This Is Not a Trading Signal
The ZenvestAI framework intentionally stops short of translating an analytical metric into a buy, sell, or hold instruction.
FVBM and SLSI are designed to improve the quality and depth of protocol research by identifying relationships between supply expansion, economic absorption, liquidity persistence and market conditions.
They should therefore be considered research measures rather than deterministic trading signals.
10. Continue the Research
Readers who want to examine the complete architecture, methodology, definitions and regulatory context behind these measures can explore the dedicated ZenvestAI research framework:
Token Economic Resilience Framework: Evaluating Crypto Value
The framework provides a deeper treatment of:
- Supply Pressure
- Economic Absorption
- FVBM methodology
- Liquidity Quality
- SLSI methodology
- Mercenary versus sticky TVL
- Combined FVBM/SLSI analysis
- Research methodology and validation
- Regulatory context
- Research and methodology disclosures