At a Glance: Bitcoin Market Overview
| Metric / Level | Market Status | Technical Implication |
| Current BTC Price | ~$77,600 (August 29, 2026) | Consolidating in a crucial decision zone |
| Immediate Resistance | $80,000 – $83,000 | Heavy profit-taking and rejection zone |
| Key Support Range | $75,000 – $77,000 | Bullish defense line (Kareebi Support) |
| Invalidation Level | Below $70,000 | Major structural breakdown risk |
| Primary Driver | Spot ETF Inflows & Liquidity | Institutional accumulation confirmation |
Key Takeaways:-
- Bitcoin trades around $77,600, consolidating after a sharp 25% run from the low-$60,000 zone to above $81,000.
- The $80,000–$83,000 zone remains fierce resistance, requiring high spot volume and daily candle closes to confirm a true breakout.
- Defending $75,000–$77,000 keeps the bullish trend structure intact, while a sustained drop under $70,000 invalidates the short-term recovery.
- Spot ETF demand and Treasury liquidity shifts serve as the primary macro catalysts powering institutional interest in the broader crypto market.
- Patience beats FOMO: waiting for clean confirmations or controlled pullbacks protects capital far better than chasing green candles.
Bitcoin Price Action & Trend Analysis: Surviving the Crucial Decision Zone 📊
Watching Bitcoin surge past major psychological barriers brings a rush of excitement, but sudden pullbacks can quickly trigger anxiety and second-guessing. You are likely asking yourself whether this latest move toward $81,000 marks the start of a massive continuation rally or an exhausting bull trap. This comprehensive Bitcoin price action & trend analysis breaks down real market data, institutional order flows, and essential chart levels so you can execute disciplined crypto trading strategies instead of reacting to raw emotion.
ZenvestAi Explains
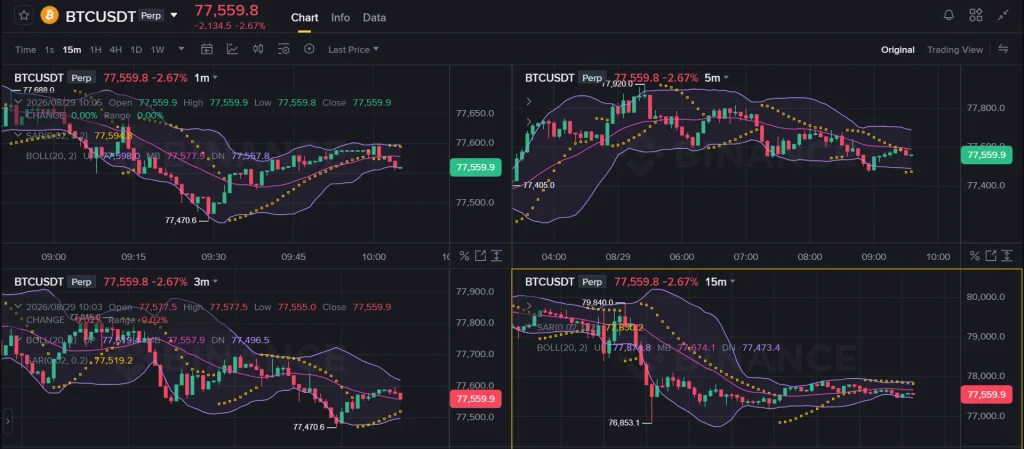
Bitcoin price action analyzes raw price movement and volume without emotional bias. As of August 29, 2026, Bitcoin is consolidating around $77,600 after touching peaks above $81,000. The primary market trend remains bullish yet cautious. A confirmed daily close above the $80,000–$83,000 resistance signals bullish continuation toward fresh highs, whereas losing the $75,000 support triggers a deeper market correction toward $70,000. Institutional spot ETF flows and macroeconomic liquidity tracked on our Bitcoin news desk continue driving overall momentum.
What This Market Guide Covers
- Core mechanics of reading Bitcoin price action and crypto market basics
- Current market trends and the August recovery path
- The macro catalysts powering the run: ETFs, liquidity, and evolving regulatory frameworks
- Critical support and resistance battlegrounds
- The trader trap: over-leverage vs. confirmed risk-to-reward setups
- Practical step-by-step checklist to trade the next major move
- Core crypto glossary and answers to top community questions
What Is Bitcoin Price Action, and Why Does It Matter?
Price action is the purest language of the market because it reveals the exact battle between aggressive buyers and defensive sellers. When you analyze crypto technical analysis charts directly, you strip away speculative noise and focus solely on real capital commitments.
Core Elements of Price Action
- Higher Highs & Higher Lows: The definitive fingerprint of an active uptrend across the market structure.
- Support & Resistance: Key price memory zones where large orders sit.
- Volume Spread Analysis: Confirmation of whether institutions are buying or dumping.
- Candlestick Formations: Real-time clues indicating momentum shifts or exhaustion.
- Institutional ETF Demand: Daily net cash inflows into regulated spot products.
Zenvestai Quick Insight:
Price action reflects real capital execution rather than speculative commentary. While news headlines explain market sentiment, raw price action confirms whether institutional traders are validating those headlines with real money.
How Did Bitcoin Rebound from $60,000 to $81,000?
Bitcoin experienced a rapid 25% surge over two weeks, climbing out of the low-$60,000 basement directly into an aggressive test of $81,000. In addition, this sharp recovery shifted broader market sentiment from fear into intense optimism, as highlighted in our trending crypto market stories.
August Lows (~$62,000) ──► ETF Inflows Accelerate ──► Surge Past $75,000 ──► Peak at $81,000 ──► Pullback to $77,600
Primary Catalysts Fueling the Rally 🚀
- Spot ETF Inflows: Institutional funds resumed steady net accumulation, removing thousands of BTC from circulating spot supplies.
- Treasury & Liquidity Dynamics: Expansions in long-term bond buybacks sparked discussions around dollar debasement, boosting hard assets like Bitcoin and gold alongside emerging 2026 crypto market trends.
- Regulatory Tailwinds: Constructive legislative debates detailed in our analysis of the future of crypto regulations provided institutional investors with clearer legal certainty.
The $80,000–$83,000 Resistance: Breakthrough or Bull Trap?
The $80,000 region represents a major psychological and technical ceiling where short-term traders frequently look to take profit (TP). Slicing through resistance temporarily is easy; establishing sustained acceptance above it is the real challenge.
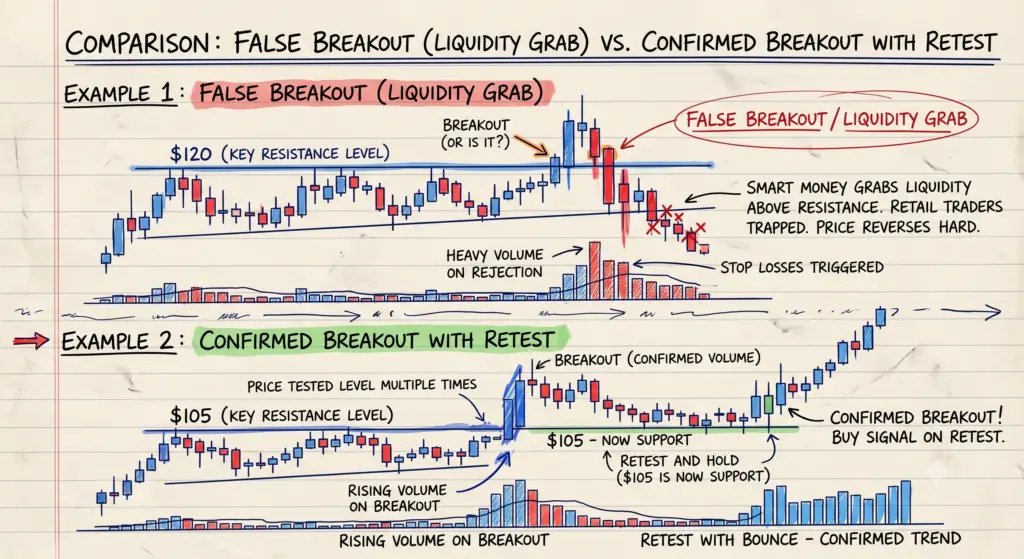
Anatomy of a Confirmed Bullish Breakout
- Daily Candle Closes: Full-bodied daily candles closing decisively above $83,000.
- Spot Volume Surge: Strong volume expansion led by spot buyers rather than high-leverage crypto futures trading.
- Support-Resistance Flip: The previous $80,000 resistance acting as dependable support on backtests.
Key Support Levels: Where Is the Buyer’s Safety Net?
The $75,000–$77,000 demand pocket (Majboot Support) acts as the immediate line in the sand for short-term swing traders. If buyers aggressively defend this range, the current pullback remains a healthy consolidation according to ongoing risk watch parameters.
Critical Downside Price Map
- Tier 1 Support ($75,000 – $77,000): Immediate consolidation floor maintaining short-term bullish momentum.
- Tier 2 Support (~$73,900): Intermediate retest zone during sharp liquidation wicks.
- Structural Invalidation ($70,000): The macro baseline; losing this level breaks the entire August market structure.
Zenvestai Quick Insight:
A healthy market requires periodic corrections to absorb sell pressure. A pullback into $75,000–$77,000 allows the market to build sustainable liquidity before attempting another breakout toward all-time highs.
The Trader’s Dilemma: Spotting Common Traps ⚠️
Inexperienced market participants often experience FOMO (Fear of Missing Out) and buy right at technical resistance levels. Consequently, they get caught in normal market pullbacks without understanding basic margin trading risks or possessing a clear capital protection plan.
Comparison: Emotional Chasing vs. Systematic Strategy
| Action Factor | Emotional Trader | Disciplined Trader |
| Entry Point | Buys after a 20%+ green candle run | Buys key support pullbacks or confirmed retests |
| Leverage | High derivative leverage (20x–50x) | Spot accumulation or low, calculated leverage |
| Risk Invalidation | No stop-loss plan; trades on hope | Pre-defined stop-loss below structural support (Risk-Reward Guide) |
| Reaction to News | Chases wild headlines instantly | Waits for price and volume confirmation |
Step-by-Step Guide: How to Navigate the Current Trend 🎯
- Track Daily Spot Inflows: Verify whether spot ETF providers are registering consistent net accumulation.
- Monitor the US Dollar Index (DXY): Ensure macroeconomic liquidity conditions remain favorable for risk assets.
- Identify Local Market Structure: Look for clear daily higher-low formations above the $75,000 support.
- Avoid Chasing Green Spikes: Enter positions during controlled pullbacks into demand zones.
- Set Defined Invalidation Points: Place stop-losses below structural levels like $74,500 to keep risk strictly contained.
Crypto Price Action Glossary
- Support: A price level where demand is strong enough to prevent the asset from falling further.
- Resistance: A price ceiling where selling pressure reliably halts upward momentum.
- False Breakout (Fakeout): A temporary price move outside a technical range that quickly reverses, trapping breakout traders.
- Open Interest (OI): The total number of outstanding derivative contracts that have not been settled.
- Spot Demand: Direct purchases of actual Bitcoin tokens rather than derivative or leveraged bets.
The Bottom Line
Bitcoin’s path from $60,000 to above $81,000 proves that institutional demand and underlying market strength remain resilient. While the current consolidation at $77,600 tests trader patience, watching key structural price levels provides clarity amidst market noise. Stay disciplined, manage your downside risk diligently, and align your decisions with a proven framework like The Complete Bitcoin Wealth Strategy for long-term compounding.
What is your personal trading plan for this $75K–$83K consolidation zone? Are you adding to spot bags on pullbacks, or waiting on the sidelines for a confirmed breakout? Share your thoughts below!
Explore Related Guides & Advanced Strategies
Crypto Trading & Derivatives Playbooks
- How to Start Crypto Futures Trading with Low Capital
- Ultimate Guide: What Is Crypto Portfolio Margin Financing?
- Mastering the Pionex Futures Grid Bot for Automated Trading
- What Are Crypto Options? Beginner’s Guide | How Crypto Options Work | Calls, Puts & Exercise Styles
- How AI Is Transforming Cryptocurrency Trading in 2026
- The Ultimate Guide to Spatial Arbitrage & DEX Routing
Fundamental & Web3 Education
- A Beginner’s Guide to Cryptocurrency and Blockchain Technology
- What Is Cryptocurrency? The Ultimate Beginner’s Guide
- What Is Blockchain? | How Blockchain Works
- The Complete Ethereum Wealth Strategy & Ethereum Glamsterdam Upgrade Guide
- Understanding Tokenization & Wholesale Digital Assets | Tokenization for Small Businesses
- What Is Crypto Staking? | Why Does Staking Exist?
- How Distributed Ledgers Are Rewriting Modern Finance
- The Ultimate Guide to Crypto Wallets | How to Safely Set Up a Binance Account | Binance Virtual Card Guide
Topic Hubs & Pillar Navigation
Trading Pillars: Trading Hub | Spot Trading | Crypto Futures Trading | Margin Trading | Portfolio Margin Trading | Options Trading | Options Trading Guide | Crypto Arbitrage
Learn & Basics: Start Here | Learn Crypto | Crypto Basics | Blockchain | Blockchain Basics | Crypto Wallets
DeFi & Yield: DeFi Hub | Crypto Staking | Yield | Liquidity Pools | Stablecoins
News & Research: Crypto News | Bitcoin News | Ethereum News | Trending News | Top News | Breaking Stories | Crypto in 60 Seconds | Crypto Research
Security & Compliance: Security Hub | Crypto Security | Wallet Security | DeFi Security | Crypto Scams | Regulation Hub | Editorial Policy | Privacy Policy | Disclaimer