Pionex Futures Grid Bot is one of the more advanced ways to automate cryptocurrency futures trading. Instead of manually watching a chart and placing every buy or sell order yourself, the bot follows a predefined grid strategy and automatically manages orders around a selected price range.
That sounds simple—and in one sense, it is. But futures trading adds leverage, margin, funding costs, and liquidation risk to the equation.
So, using a Futures Grid Bot successfully is not simply about choosing more grids or higher leverage. The real skill is understanding when the strategy fits the market, how much capital to allocate, where the grid should sit, how much risk to accept, and when to stop the bot.
This guide takes you from the basics to advanced concepts, including setup, grid parameters, leverage, margin, risk management, capital efficiency, fees, practical examples, optimization strategies, and common mistakes.
Important: A trading bot does not guarantee profits. Futures trading can result in rapid losses, including liquidation. The examples in this guide are for educational purposes and should not be considered financial advice.
What Is the Pionex Futures Grid Bot?
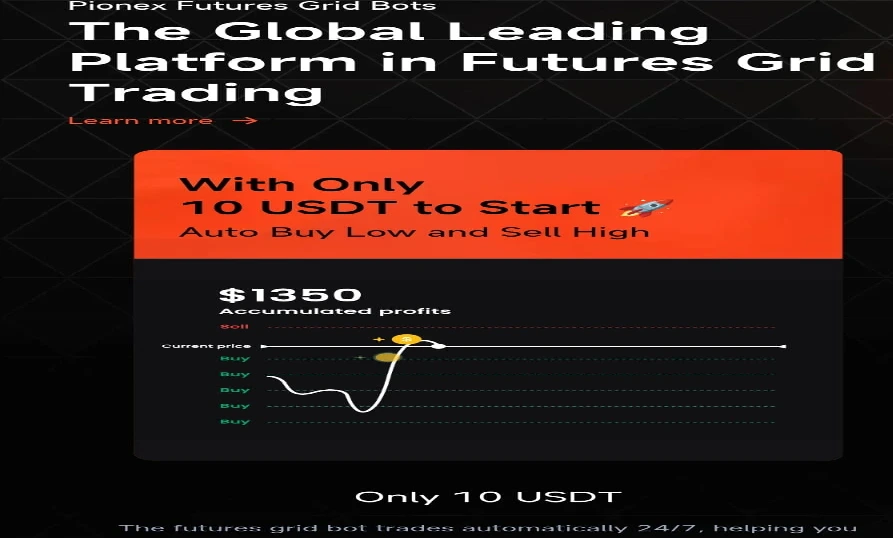
A Pionex Futures Grid Bot is an automated trading strategy that places and manages orders around a predefined price range using cryptocurrency futures contracts.
The basic idea is straightforward:
Price moves → the bot executes grid orders → completed trades can generate grid profit.
Unlike a traditional spot grid, a Futures Grid Bot works with futures contracts. This means traders can potentially use:
- Long positions
- Short positions
- Leverage
- Margin
- Futures-based exposure
However, these additional features also introduce additional risks.
Simple Example
Suppose Bitcoin is trading around $100,000.
You create a Futures Grid Bot with:
- Lower price: $90,000
- Upper price: $110,000
- Direction: Long
- Multiple grid levels
- Defined investment
- Conservative leverage
The bot divides the selected range into multiple price levels.
If BTC moves downward through the grid, the bot can open positions according to its strategy.
If BTC subsequently moves upward, corresponding orders can close positions and capture part of the price movement.
The objective is not to predict the exact top or bottom.
Instead, the bot attempts to profit from repeated price fluctuations within the selected trading range.
Why Use a Futures Grid Bot?
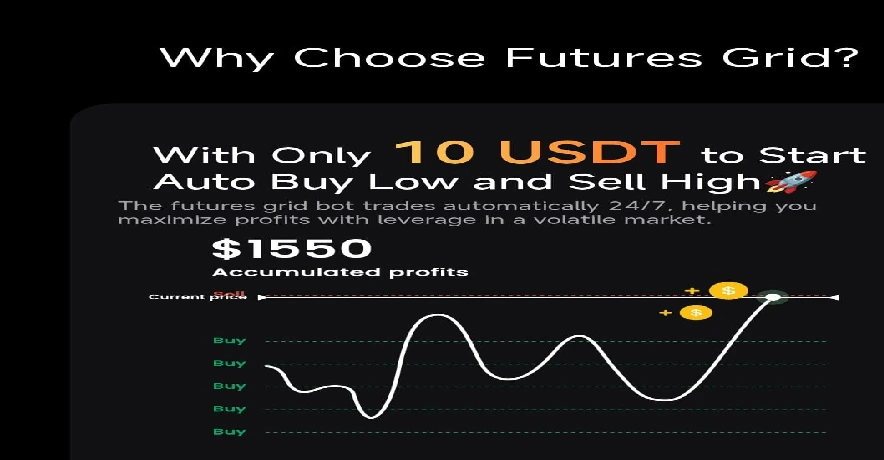
Manual futures trading requires constant attention.
You need to:
- Watch the chart
- Identify entries
- Place orders
- Manage positions
- Adjust stops
- Monitor leverage
- Track funding
- Calculate profit and loss
- Decide when to exit
A bot can automate much of this repetitive execution.
That can be useful when the market is moving back and forth and you want a systematic approach rather than constantly making emotional decisions.
However, automation does not remove risk.
A bot will follow the strategy you give it—even when the market changes dramatically.
That is one of the most important principles to understand:
Automation removes some execution work. It does not remove market risk.
How Futures Grid Trading Actually Works
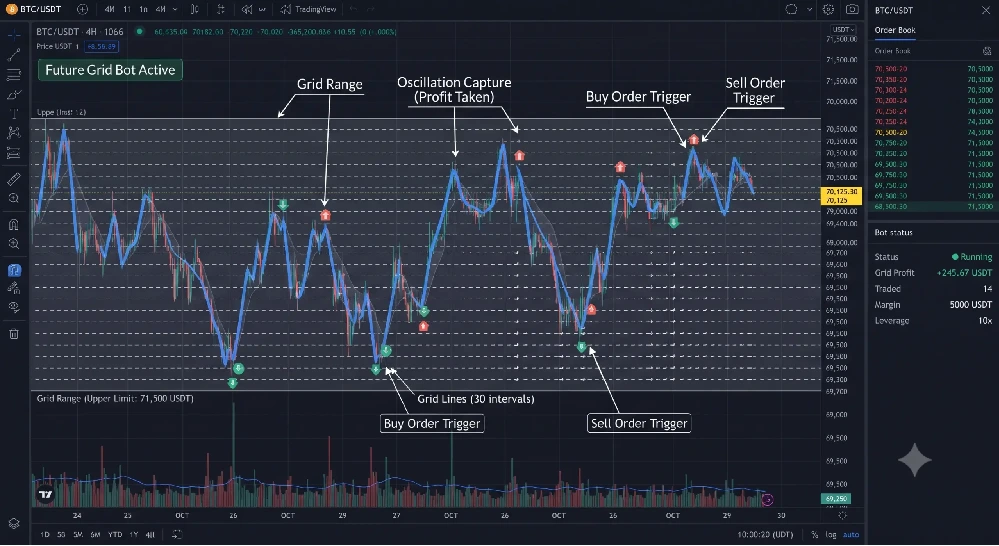
Think of the grid as a staircase of prices.
For example:
$110,000 ───── Upper Range
$108,000 ───── Grid
$106,000 ───── Grid
$104,000 ───── Grid
$102,000 ───── Grid
$100,000 ───── Current Price
$98,000  ───── Grid
$96,000  ───── Grid
$94,000  ───── Grid
$92,000  ───── Grid
$90,000  ───── Lower Range
Instead of waiting for one perfect entry, the strategy works across multiple levels.
The exact execution logic depends on the selected Futures Grid configuration, but the central concept remains the same:
The bot attempts to capture repeated price movements between predefined levels.
This is why grid trading generally makes more sense in markets that are moving back and forth within a reasonably identifiable range than in markets experiencing an aggressive one-directional breakout.
Futures Grid vs Spot Grid
This distinction is extremely important.
Spot Grid
A Spot Grid Bot trades the underlying cryptocurrency.
For example, a BTC/USDT Spot Grid can buy and sell actual BTC according to its grid strategy.
Futures Grid
A Futures Grid trades a futures contract.
You do not simply own the underlying BTC in the same way as with spot trading.
Instead, your margin supports a futures position.
Main Differences
| Feature | Spot Grid | Futures Grid |
|---|---|---|
| Underlying asset ownership | Yes | No direct ownership |
| Long exposure | Yes | Yes |
| Short exposure | Limited/strategy dependent | Yes |
| Leverage | Not inherent in normal spot trading | Available |
| Funding | No futures funding | Applicable |
| Liquidation | No futures liquidation | Possible |
| Margin | Different structure | Required |
| Complexity | Lower | Higher |
| Risk | Generally lower | Generally higher |
Futures Grid provides additional flexibility, but it also introduces additional risks that beginners should understand before using it.
What Is the Difference Between Grid Profit and Total P&L?
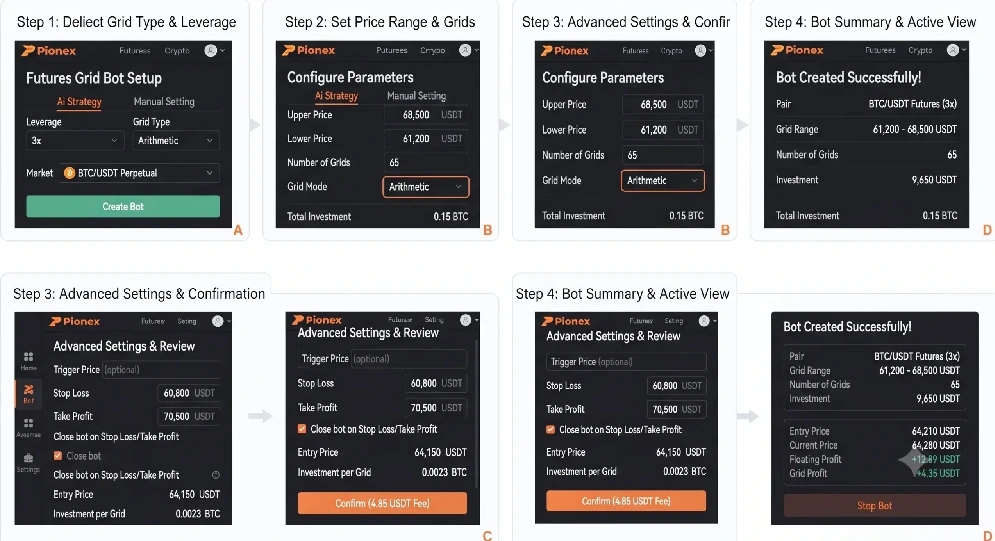
This is one of the most important concepts for beginners.
You may open your bot and see:
Grid Profit: +$50
and assume:
“I am making $50.”
Not necessarily.
Your overall position could still be losing money.
Example
Suppose:
- Grid Profit = +$50
- Unrealized Loss = -$120
- Fees and Funding = -$10
Your approximate result would be:
$50 − $120 − $10 = −$80
So the bot can show positive grid profit while the overall position remains negative.
This happens because grid profit comes from completed grid trades, while Total P&L considers the broader position result, including unrealized gains or losses and other applicable costs.
Always Monitor Total P&L
Do not judge the performance of a Futures Grid Bot only by its Grid Profit.
Look at:
Total P&L + margin condition + liquidation distance + funding + fees.
Understanding the Main Futures Grid Parameters
Before starting a bot, you need to understand the major settings.
Trading Pair
The first decision is what asset you want to trade.
Examples can include:
- BTC/USDT
- ETH/USDT
- Other supported futures pairs
For beginners, highly liquid major cryptocurrencies are generally easier to monitor than thin, highly speculative tokens.
Liquidity matters because spreads, slippage, and sudden price movements can become more problematic in less liquid markets.
Lower Price
The lower price establishes the bottom of your selected grid range.
For example:
Lower Price = $90,000
This means the strategy has been designed around a range beginning at $90,000.
The lower boundary should not be selected randomly.
You should consider:
- Recent support
- Historical volatility
- ATR
- Market structure
- Previous swing lows
- Major liquidity zones
- Current trend
- Expected volatility
A lower boundary that is too close to the current price may be broken quickly.
A boundary that is extremely wide may reduce the frequency of grid executions.
Upper Price
The upper price defines the top of the grid.
Example:
Upper Price = $110,000
Now your range is:
$90,000–$110,000
The bot is designed around this price zone.
If BTC moves strongly above the range, the strategy may stop placing new grid orders outside that boundary.
If BTC falls below the range, the same basic issue can occur on the downside.
The important point is that a grid range is not a permanent prediction of the market. It is simply the environment in which you designed the strategy to operate.
Grid Quantity
Grid quantity determines how many levels divide your trading range.
Imagine a $20,000 range.
You might divide it into:
- 10 grids
- 20 grids
- 50 grids
- Or another number supported by the current product
More Grids
Potential advantages include:
- Smaller price intervals
- More opportunities for execution
- More frequent trades
Potential disadvantages include:
- Smaller profit per completed grid
- Greater sensitivity to fees
- More transactions
- Higher possibility that costs consume much of the expected return
Fewer Grids
Potential advantages include:
- Larger movement required for each cycle
- Potentially higher gross profit per completed grid
Potential disadvantages include:
- Fewer executions
- Longer waiting periods
- Price may move significantly without completing a grid cycle
The goal is not to use the maximum number of grids.
The goal is:
Use grid spacing that makes sense for the asset’s volatility, liquidity, and trading costs.
Profit Per Grid
Profit per grid represents the potential gross return generated when a grid cycle is completed.
For example, if the grid spacing represents approximately 0.5%, a completed cycle may generate a gross return around that level before applicable costs.
But remember:
Gross grid profit is not the same as net profit.
You need to account for:
- Trading fees
- Funding
- Slippage
- Spread
- Other applicable costs
- Unrealized P&L
A grid that generates very small profits on each transaction may not be attractive if trading costs consume most of the expected return.
Leverage: The Most Misunderstood Setting
Leverage allows a trader to control a larger futures position using a smaller amount of margin.
For example, suppose you have:
$1,000 of margin
With 3× leverage, your position exposure can be substantially larger than the initial margin, depending on the product’s rules and position structure.
That sounds attractive.
But leverage works in both directions.
If the market moves in your favor, returns on your margin can increase.
If the market moves against you, losses can increase much faster.
The Wrong Question
Many beginners ask:
“What leverage gives the highest profit?”
The better question is:
“What leverage gives the strategy enough room to survive normal market volatility?”
This is a much more professional way to think about futures trading.
Why High Leverage Can Destroy a Grid Strategy
Imagine BTC is trading at $100,000.
You create a highly leveraged long grid.
Then BTC suddenly falls 8%.
Your grid may continue generating small completed trades.
But your open position could be suffering a much larger unrealized loss.
If the price reaches the liquidation level before recovering, the position can be forcibly closed.
At that point, it does not matter if BTC later returns to $100,000.
The position has already been liquidated.
This is why grid trading with excessive leverage can create a dangerous illusion:
Small frequent profits can hide a large open-position risk.
Margin Management
Margin is the financial cushion supporting your futures position.
You should think about margin as survival capital, not simply trading capital.
A larger margin cushion can give a position more room to withstand adverse price movements, although it does not eliminate risk.
Adding more margin should never become an automatic response to every losing trade.
Avoid the Margin Trap
Suppose a bot is losing money.
You add more capital.
It loses again.
You add more.
This can turn a small planned loss into a large uncontrolled position.
Instead, establish your maximum acceptable risk before starting the bot.
What Is Liquidation?
Liquidation occurs when the position reaches the exchange’s liquidation requirements.
The exact calculation depends on factors such as:
- Position size
- Entry price
- Leverage
- Available margin
- Maintenance margin
- Fees
- Funding
- Exchange-specific rules
Your liquidation price should therefore be treated as a critical risk boundary.
A Futures Grid strategy is not safe simply because its grid range looks wide.
You must also examine where liquidation sits relative to that range.
The Golden Rule: Keep Liquidation Away From the Working Range
Suppose:
Grid Range: $90,000–$110,000
and your estimated liquidation price is:
$92,000
That is a dangerous configuration.
Your liquidation level is inside your intended trading zone.
A relatively normal downward movement could destroy the strategy before the grid has enough opportunity to operate.
A more robust configuration generally aims to keep liquidation sufficiently beyond the working range while still considering extreme market volatility.
How to Choose a Good Grid Range
There is no universal perfect range.
Your range should reflect the market you are trading.
Consider the following factors.
Market Structure
Identify:
- Major support
- Major resistance
- Swing highs
- Swing lows
- Consolidation zones
Volatility
Consider:
- ATR
- Historical volatility
- Average daily range
- Recent price expansion
Timeframe
A grid designed around a 15-minute market structure will usually have different boundaries from one designed around a 4-hour or daily structure.
Major Events
Be cautious around events such as:
- FOMC decisions
- CPI releases
- Major employment reports
- Major ETF developments
- Regulatory announcements
- Token unlocks
- Exchange announcements
- Major network upgrades
The greater the expected volatility, the more dangerous a tight grid can become.
A Practical Range-Building Method
Instead of randomly selecting prices, use a structured process.
Step 1: Identify the Current Price
Example:
BTC = $100,000
Step 2: Identify Recent Support
Suppose significant support appears around:
$92,000
Step 3: Identify Resistance
Suppose resistance appears around:
$108,000
Step 4: Add a Volatility Buffer
Consider whether normal volatility could temporarily push price outside those levels.
Step 5: Check Liquidation
Make sure your selected leverage does not put liquidation dangerously close to the grid.
Step 6: Check Expected Grid Profit
Make sure the expected movement between levels is meaningful after estimated costs.
AI Strategy vs Manual Strategy
Pionex provides AI-assisted strategies for certain bot configurations.
These suggestions can help beginners start with parameters based on historical market data.
However:
AI parameters are suggestions, not guarantees.
Historical data cannot predict:
- Black swan events
- Sudden liquidation cascades
- Unexpected regulation
- Exchange problems
- Future volatility
- Major news shocks
Best Approach
Use AI as:
A starting point—not a substitute for risk management.
Manual Strategy
Manual configuration gives you greater control.
You can determine:
- Range
- Grid structure
- Investment
- Direction
- Leverage
- Risk controls
This can be useful when you already have a specific market thesis.
For example:
“BTC has entered a range between $92,000 and $108,000, volatility is declining, and I expect continued consolidation.”
That is a stronger reason for using a grid than simply choosing a strategy because it displays a high projected return.
How to Set Up a Pionex Futures Grid Bot
The exact Pionex interface can change as the platform updates its products and app. Therefore, treat the following as the general workflow rather than assuming every button will look exactly the same.
Step 1: Open Pionex
Log in through the official Pionex app or website.
Step 2: Navigate to Futures Bots
Open the Futures section and select the available Futures Grid option.
Step 3: Choose the Trading Pair
Select a supported futures contract.
Step 4: Choose the Direction
Depending on the bot type, available structures may include:
- Long
- Short
- Neutral or paired structures
Step 5: Select AI or Manual Strategy
Beginners can use AI suggestions as a reference.
Experienced traders can configure their own parameters.
Step 6: Set Investment
Choose how much capital you are willing to allocate.
Step 7: Set Leverage
Use conservative leverage rather than automatically selecting the highest available option.
Step 8: Set the Grid Range
Enter the upper and lower boundaries.
Step 9: Set Grid Quantity
Choose a number that produces sensible spacing.
Step 10: Review Liquidation
Never skip this step.
Step 11: Review Fees and Funding
Determine whether expected grid profit is large enough to justify the costs.
Step 12: Add Risk Controls
Where supported, configure:
- Stop-loss
- Take-profit
- Trigger conditions
- Margin controls
Step 13: Start the Bot
Only start after reviewing the complete configuration.
Cross Margin Futures Grids
Pionex also offers Cross Margin Futures Grid functionality.
This is an advanced concept that allows a long grid and short grid on the same futures contract to share margin.
Conceptually:
                BTC Futures
                      |
          +-----------+-----------+
          |                       |
       LONG GRID               SHORT GRID
          |                       |
          +-----------+-----------+
                      |
                Shared Margin
The potential benefit is improved capital utilization because the two strategies can use shared margin rather than treating each side as completely separate.
However, shared margin does not mean zero risk.
The strategies can still experience:
- Trading fees
- Funding costs
- Execution risk
- Market risk
- Margin pressure
- Large drawdowns
Treat cross-margin structures as advanced strategies rather than beginner tools.
When Does a Futures Grid Work Best?
Grid strategies generally make more sense when price is repeatedly oscillating rather than moving aggressively in one direction.
Potentially Favorable Environment
- Sideways market
- Range-bound market
- Moderate volatility
- Frequent price reversals
- Strong liquidity
- Clearly defined support and resistance
More Difficult Environment
- Strong breakout
- Strong trend
- Sudden crash
- Sudden pump
- Low liquidity
- Major unexpected news
A grid does not magically turn a strong downtrend into a profitable market.
If price keeps falling, a long grid can accumulate losses.
If price keeps rising, a short grid can face increasing losses.
Why Grid Bots Struggle During Strong Trends
Imagine BTC trades between:
$90,000 and $110,000
You create a long grid.
Then BTC suddenly drops:
$100,000 → $95,000 → $90,000 → $85,000
The bot may have executed several grid trades.
But the broader market has moved outside the strategy’s expected range.
Now the important question becomes:
Will BTC return to the range, or is a new downtrend beginning?
This is where human judgment becomes important.
Automation cannot know the future.
Stop-Loss Strategy
A stop-loss is designed to limit damage if the market moves beyond your trading thesis.
For a long grid, a stop may be positioned below the intended range.
For a short grid, a stop may be positioned above the intended range.
However, the stop should not be so close that normal volatility constantly triggers it.
A stop should be considered in relation to:
- Market structure
- Volatility
- Risk tolerance
- Liquidation distance
- Strategy timeframe
The objective is not to avoid every losing trade.
The objective is to prevent one losing trade from becoming a catastrophic loss.
Take-Profit Strategy
Take-profit controls can automatically close a strategy once a predefined objective has been reached.
This can be useful when:
- Price reaches major resistance
- Your expected range is complete
- A large trend move occurs
- Your target return has been achieved
But if the market continues moving after the bot closes, you may miss additional gains.
That is not necessarily a failure.
A planned profit is better than an unplanned hope for more profit.
Capital Allocation: The Most Important Decision
Suppose your total trading capital is:
$10,000
That does not mean your Futures Grid should use all $10,000.
A more conservative approach is to allocate only a defined portion to automated futures strategies.
For example:
- Total capital = $10,000
- Grid allocation = $2,000
- Reserve = $8,000
The exact allocation should depend on your financial circumstances and risk tolerance.
The important principle is:
Do not allow one bot to control your entire trading account.
Capital Efficiency Does Not Mean Maximum Leverage
This distinction is extremely important.
Many traders hear:
“Capital efficiency.”
and immediately think:
“Use more leverage.”
That is incorrect.
Capital efficiency means getting useful exposure from your capital without taking unnecessary risk.
A strategy using moderate leverage, sensible grid spacing, adequate margin, and controlled exposure may be more capital-efficient over the long term than a highly leveraged strategy that gets liquidated during one unexpected move.
A Better Capital-Efficiency Framework
Think about your trading capital in four layers.
Layer 1: Active Capital
Money currently allocated to the bot.
Layer 2: Risk Reserve
Capital available for planned strategy adjustments or margin management.
Layer 3: Opportunity Capital
Capital reserved for better opportunities that may appear later.
Layer 4: Emergency Reserve
Capital that is not used for speculative trading.
This structure can help prevent the common mistake of putting every available dollar into one leveraged strategy.
Realistic Example: Conservative Futures Grid
Let’s create a hypothetical example.
Assume:
Capital: $2,000
BTC price: $100,000
Grid range: $92,000–$108,000
Leverage: 2×
Strategy: Long Grid
Suppose the bot divides the range into multiple levels.
BTC moves:
$100,000 → $98,500 → $97,000 → $99,000 → $101,000
The grid may capture several price movements.
But the actual result depends on:
- Position size
- Exact grid spacing
- Fees
- Funding
- Execution
- Unrealized P&L
- Market movement
Therefore, you should never calculate expected profit simply by multiplying:
Number of grids × expected profit
That ignores whether orders actually execute and what happens to open positions.
Example of a Bad Configuration
Consider:
Capital: $1,000
Leverage: Extremely high
Range: Very narrow
Grid count: Very high
Stop-loss: None
At first, the bot produces frequent small profits.
Then BTC moves 6–8% against the strategy.
The open position begins producing a large unrealized loss.
Funding and trading costs continue.
The liquidation price gets closer.
Eventually, the position can be forcibly closed.
This is the classic problem of optimizing for trade frequency instead of survival.
Fees and Funding Costs
Automated trading does not mean free trading.
You need to consider several costs.
Trading Fees
Executed transactions can incur trading fees.
Funding
Perpetual futures can involve periodic funding payments between long and short participants.
Slippage
Actual execution can differ from the expected price, particularly during fast markets.
Spread
The difference between bid and ask can affect execution quality.
Opportunity Cost
Capital committed to one strategy cannot simultaneously be used elsewhere.
A grid that generates frequent small gross profits may still be unattractive if costs consume most of the strategy’s edge.
A Simple Net Profit Formula
A useful simplified framework is:
Net Profit ≈ Grid Profit + Unrealized P&L − Trading Fees − Funding − Other Costs
This is not a replacement for the exchange’s actual P&L calculation, but it helps you think about performance correctly.
Always evaluate the complete position rather than one performance metric.
Grid Spacing: Too Tight vs Too Wide
Too Tight
Potential problems include:
- Tiny profit per trade
- Costs consuming the expected edge
- Excessive activity
- Noise-driven execution
Too Wide
Potential problems include:
- Fewer trades
- Long waiting periods
- Large movement required
- Capital potentially sitting idle
The Sweet Spot
You want enough spacing to make each trade economically meaningful while still allowing the bot to capture normal market fluctuations.
There is no universal percentage.
It depends on:
- Asset
- Volatility
- Fees
- Timeframe
- Market conditions
How to Use Technical Analysis With a Grid Bot
A grid bot does not eliminate the need for market analysis.
Technical analysis can help determine whether the market is suitable for a grid strategy.
Useful tools include:
Bollinger Bands
Useful for identifying periods of compression and expansion.
ATR
Useful for estimating typical price movement.
Support and Resistance
Useful for identifying potential grid boundaries.
Volume
Useful for assessing market participation and potential breakout strength.
RSI
Can help identify momentum extremes, although it should not be used by itself.
Moving Averages
Useful for identifying broader trend direction.
A Simple Market Filter
Before starting the bot, ask:
Question 1
Is price currently ranging?
Question 2
Is volatility reasonable?
Question 3
Is liquidity sufficient?
Question 4
Is there a major event approaching?
Question 5
Can the selected range survive normal volatility?
Question 6
Is liquidation safely away from the range?
Question 7
Is expected grid profit meaningful after costs?
If several answers are “no,” do not force the strategy.
No trade is also a trading decision.
Advanced Strategy: Trend + Grid
A common mistake is treating grid trading as completely independent from market direction.
A more advanced approach is to combine:
Trend filter + Grid strategy
For example:
- Strong bullish trend → favor long-oriented strategies
- Strong bearish trend → favor short-oriented strategies
- Neutral or ranging market → consider balanced grid structures
The exact implementation depends on the available Pionex bot type and your risk model.
Advanced Strategy: Volatility-Based Grid Adjustment
Instead of keeping the same grid range forever, monitor volatility.
If volatility increases:
- Consider widening the range
- Reduce leverage
- Reduce position size
- Increase liquidation distance
- Consider pausing the bot
If volatility decreases:
- A narrower range may become more practical
However, do not continuously change parameters simply because the market moves slightly.
Frequent manual intervention can turn a systematic strategy into emotional trading.
Advanced Strategy: Event-Based Risk Control
One of the strongest improvements is to treat major market events differently.
For example, before a major economic announcement you could:
Option A: Reduce exposure.
Option B: Close the bot.
Option C: Adjust the strategy to account for expected volatility.
Option D: Keep the strategy unchanged if it was specifically designed for such conditions.
There is no universal answer.
The important part is making the decision before the event, rather than reacting emotionally afterward.
Advanced Strategy: Long Grid vs Short Grid
Long Grid
A long grid is designed around bullish exposure.
It can be more suitable for:
- Sideways-to-bullish environments
- Supportive market structure
- Controlled downside risk
Short Grid
A short grid is designed around bearish exposure.
It can be more suitable for:
- Sideways-to-bearish environments
- Resistance-heavy markets
- Weak market structure
Neither is automatically superior.
The correct direction depends on the market.
Advanced Strategy: Cross-Margin Long + Short Grid
Pionex’s Cross Margin Futures Grid structure introduces a more advanced approach where long and short grids can share margin on the same futures contract.
The potential advantage is improved capital utilization.
But there is an important warning:
Shared margin is not the same thing as risk-free hedging.
The two strategies can still experience:
- Trading costs
- Funding effects
- Execution risk
- Market risk
- Margin pressure
- Large drawdowns
Treat this as an advanced structure that requires a good understanding of futures mechanics.
When Should You Stop the Bot?
This is one of the most important questions.
Consider stopping the bot when:
- Price breaks the fundamental range
- Market regime changes
- Volatility becomes extreme
- Your original thesis is invalid
- Liquidation becomes too close
- Funding becomes unattractive
- The asset experiences a major unexpected event
- Total P&L reaches your predetermined loss limit
- You no longer understand why the bot should remain active
Do not keep a losing bot alive simply because:
“It will probably recover.”
That is hope, not risk management.
How Often Should You Monitor the Bot?
You do not necessarily need to stare at the bot every minute.
But you should regularly review:
- Total P&L
- Unrealized P&L
- Grid Profit
- Funding
- Margin ratio
- Liquidation price
- Current market price
- Distance from grid boundaries
- Market volatility
- Major news
A bot can automate execution.
You still manage the strategy.
A Professional Pre-Trade Checklist
Before starting a Futures Grid Bot, ask:
Market
- Is the asset liquid?
- Is the market ranging?
- Is volatility reasonable?
- Is there a strong trend?
- Are major events approaching?
Grid
- Is the range logical?
- Is the grid spacing reasonable?
- Is expected profit per grid meaningful?
- Are fees accounted for?
Risk
- Is leverage conservative?
- Is liquidation safely away?
- Is a stop-loss appropriate?
- How much capital is allocated?
- What is the maximum acceptable loss?
Strategy
- Why am I using a grid?
- Why this asset?
- Why this range?
- Why this direction?
- What will make me stop the bot?
If you cannot answer these questions, you probably should not start the bot yet.
A Professional Post-Trade Checklist
After closing the bot, don’t just look at the final profit.
Record:
- Starting capital
- Ending capital
- Grid profit
- Total P&L
- Maximum drawdown
- Maximum adverse movement
- Funding paid
- Trading fees
- Duration
- Number of completed grid cycles
- Market conditions
Then ask:
What worked?
What failed?
Would I use the same configuration again?
This turns bot trading into a measurable process instead of gambling.
How to Improve Capital Efficiency
Capital efficiency should be measured through risk-adjusted performance, not headline returns.
A better framework is:
Step 1: Reduce Unnecessary Leverage
Use only the leverage required for the strategy.
Step 2: Keep Reserve Capital
Do not commit everything.
Step 3: Use Liquid Markets
Liquidity can improve execution quality.
Step 4: Avoid Excessive Grid Density
More trades do not automatically mean more profits.
Step 5: Monitor Margin
Keep enough room for normal adverse movement.
Step 6: Review Total P&L
Do not optimize based only on grid profit.
Step 7: Compare Opportunity Cost
Ask whether your capital is producing enough return relative to the risk.
The Capital-Efficiency Equation
A useful conceptual framework is:
Capital Efficiency = Useful Exposure ÷ Capital Committed
But professional trading requires another layer:
Risk-Adjusted Capital Efficiency = Useful Exposure ÷ Capital Risked
This distinction is critical.
A strategy that produces 3× exposure but has a high liquidation probability is not necessarily more efficient than a 1.5× strategy that survives normal market conditions.
Should Beginners Use Pionex Futures Grid?
Beginners should understand basic spot and futures concepts before moving into leveraged automated strategies.
A sensible learning progression is:
Crypto basics → Spot trading → Grid trading concepts → Small-size testing → Futures mechanics → Futures Grid → Advanced margin strategies
If you are unfamiliar with:
- Leverage
- Margin
- Funding
- Liquidation
- Mark price
- Unrealized P&L
learn these concepts before committing meaningful capital.
Futures Grid vs Manual Futures Trading
| Factor | Manual Futures | Futures Grid |
|---|---|---|
| Execution | Manual | Automated |
| Emotional decisions | Higher | Potentially lower during execution |
| Strategy flexibility | Very high | Parameter-based |
| Monitoring | High | Lower, but still required |
| Range trading | Manual | Automated |
| Leverage risk | Yes | Yes |
| Liquidation risk | Yes | Yes |
| Requires market thesis | Yes | Yes |
| Guaranteed profit | No | No |
The bot does not replace the trader.
It changes how the strategy is executed.
Futures Grid vs Futures DCA
These strategies are also different.
A Futures Grid attempts to capture repeated price movements across predefined levels.
A Futures DCA strategy generally averages entries according to predetermined rules.
Grid
Best suited to:
Repeated price oscillation
DCA
Best suited to:
Structured averaging according to predefined entry rules
Neither is automatically better.
The right choice depends on your strategy and market conditions.
What If the Market Breaks Out?
This is where you need a plan.
Bullish Breakout
A long grid may benefit from the move, but the original range can become outdated.
Bearish Breakout
A long grid can become dangerous.
Strong Reversal
A grid that worked perfectly for several hours can suddenly become exposed to the opposite direction.
The solution is not to predict every breakout.
The solution is to define:
What happens if price leaves my range?
before starting the bot.
Can a Futures Grid Bot Guarantee Passive Income?
No.
This is one of the biggest misconceptions about automated trading.
A bot can automate trading.
It cannot guarantee:
- Profit
- Stable income
- Low drawdown
- No liquidation
- Successful recovery after a crash
Think of a bot as an automated execution engine—not an automated money printer.
The Best Mindset for Automated Trading
Instead of asking:
“How much can this bot make?”
ask:
“How much can this bot lose, and under what conditions?”
Then ask:
“What would make me shut it down?”
This change in mindset can dramatically improve your risk management.
A ZenvestAI-Style Futures Grid Framework
For a disciplined approach, you can use this five-stage framework.
Stage 1 — Observe
Study the market before deploying capital.
Stage 2 — Define
Set:
- Range
- Direction
- Grid spacing
- Leverage
- Capital
- Stop-loss
- Exit conditions
Stage 3 — Deploy
Start with controlled capital.
Stage 4 — Monitor
Track:
- Total P&L
- Margin
- Liquidation
- Funding
- Volatility
Stage 5 — Review
Close, adjust, or continue based on predefined rules—not emotion.
The 10-Point Futures Grid Risk Framework
Before launching any bot, confirm:
- I understand the futures contract.
- I understand liquidation.
- I know my maximum loss.
- My leverage is appropriate.
- My grid range has a reason.
- My grid spacing accounts for costs.
- I have reserve capital.
- I have an exit plan.
- I will monitor Total P&L.
- I will stop the bot if my original thesis fails.
If you cannot check all ten, don’t rush into the trade.
Advanced Performance Metrics
Experienced traders should go beyond headline profit.
Return on Allocated Capital
ROI = Net Profit ÷ Allocated Capital × 100
Maximum Drawdown
The largest decline from a strategy peak to a subsequent low.
Win Rate
The percentage of completed trades that were profitable.
Average Grid Profit
The average profit generated by completed grid cycles.
Cost Ratio
Trading costs and funding relative to gross grid profit.
Risk-Adjusted Return
The amount of return generated relative to the volatility or downside risk taken.
These measurements help answer a much better question:
Is the strategy actually good, or did it simply get lucky in a favorable market?
Backtesting: Useful but Dangerous
Backtesting can help evaluate how a configuration would have behaved historically.
But a backtest is not a prediction.
Historical data cannot fully capture:
- Future volatility
- Liquidity changes
- Slippage
- Unexpected news
- Exchange interruptions
- Liquidation cascades
- Changes in funding
- Future market regime changes
Use backtesting as a research tool, not a promise.
How to Optimize Without Over-Optimizing
A common advanced-trader mistake is excessive optimization.
You test hundreds of combinations:
- Different grid counts
- Different leverage
- Different ranges
- Different assets
- Different timeframes
Eventually, you may find a configuration that looks amazing historically.
But it may simply be fitted to the past.
This is known as overfitting.
A more robust strategy uses parameters that make sense across multiple market conditions.
A Better Optimization Process
Test the strategy across different environments.
Scenario A
Sideways market.
Scenario B
Strong uptrend.
Scenario C
Strong downtrend.
Scenario D
High-volatility market.
Scenario E
Sudden crash.
If your strategy only works in one narrow historical environment, it may not be robust enough.
How to Build a Futures Grid Trading Journal
Create a simple spreadsheet with:
| Date | Pair | Direction | Range | Leverage | Capital | Grid Count | Grid Profit | Total P&L | Funding | Max Drawdown |
|---|
After 20–30 trades, patterns can start to appear.
You may discover:
- Your range is too narrow.
- Your leverage is too high.
- Certain assets perform better.
- Certain market conditions are unsuitable.
- Your fees are consuming too much profit.
That information can be more valuable than one lucky winning trade.
A Beginner-Friendly Starting Philosophy
If you are new to Futures Grid, focus on:
Small capital + low leverage + liquid asset + wide survival margin + clear exit plan.
Avoid starting with:
Large capital + high leverage + volatile altcoin + tight range + no stop-loss.
The second setup may look more exciting.
It is also much easier to destroy an account with it.
Is Pionex Futures Grid Suitable for Every Market?
No.
No automated strategy is suitable for every market condition.
A grid strategy depends heavily on price movement.
If the market moves outside your expected range and does not return, the strategy can become increasingly difficult to manage.
That is why market selection and regime identification are just as important as bot configuration.
Major Advantages of Pionex Futures Grid
Automation
Orders can be managed automatically according to predefined rules.
Systematic Execution
The bot follows the parameters you establish.
Long and Short Exposure
Futures structures can allow strategies for both directions.
Potential Capital Efficiency
Leverage and margin structures can create more exposure per unit of capital.
24/7 Crypto Markets
The crypto market operates around the clock, allowing automated strategies to continue operating while you are away.
Reduced Emotional Execution
A programmed strategy can reduce impulsive manual entries and exits.
Major Disadvantages
Liquidation Risk
Unlike basic spot grid trading, futures positions can be forcibly liquidated.
Leverage Risk
Losses can increase rapidly.
Funding Costs
Perpetual futures can incur funding.
Strategy Risk
A bot can continue following an outdated strategy.
Range Risk
Price can leave the grid.
Complexity
Futures require significantly more knowledge than basic spot trading.
Psychological Risk
Watching a bot lose money can tempt traders to interfere emotionally.
Final Takeaway
The Pionex Futures Grid Bot can be a powerful automation tool, but its real value does not come from simply pressing Create Bot.
The important part is what happens before that button is pressed.
You need to understand:
Market → Range → Grid → Position Size → Leverage → Margin → Liquidation → Costs → Exit Plan
When those pieces work together, a Futures Grid can become a structured way to automate a trading idea.
When they do not, automation can simply make a bad strategy execute faster and more consistently.
The biggest lesson is therefore simple:
Do not optimize your Futures Grid Bot for maximum leverage or maximum trade frequency. Optimize it for survival, consistency, and risk-adjusted capital efficiency.
Start small.
Understand the mechanics.
Use liquid markets.
Keep leverage under control.
Monitor Total P&L rather than only Grid Profit.
Know where liquidation sits.
Have a clear invalidation point.
And most importantly, never allow an automated trading bot to become an excuse for stopping your own risk management.
Official Resources
For readers who want to verify current features, procedures, and product functionality, always refer to Pionex’s current official documentation before trading.
- Pionex Futures Grid documentation
- Pionex Futures Grid FAQ
- Pionex Cross Margin Futures Grid Help Center
- Pionex Grid Bot documentation
- Pionex official website
Last reviewed: September 2026
Because exchange interfaces, supported pairs, fees, leverage limits, margin requirements, and bot features can change, always verify the current Pionex interface and official product documentation before placing a trade.