Inflation takes no prisoners at 8:30 a.m. ET: why a single decimal point from Washington can trigger a violent $4,000 Bitcoin whiplash in seconds—and how disciplined crypto investors turn macro chaos into a repeatable edge.
Every month at exactly 8:30 a.m. Eastern Time, millions of crypto traders stare at their screens in tense silence as a single government spreadsheet determines whether CPI Bitcoin positions surge in relief or vanish in a cascade of forced liquidations.
You can spend weeks researching on-chain wallet flows, layer-2 transaction growth, and decentralized finance yields. Yet watch your entire portfolio get whipsawed in ninety seconds because the price of gasoline and apartment rent in American cities came in two-tenths of a percent higher than Wall Street guessed.
Part 1 of This Article: 1. What Is CPI? A Complete Guide to U.S. Inflation Data, Core CPI & CPI Surprises
That recurring frustration—watching a borderless digital asset bow to a Washington inflation release—leaves beginners confused and over-leveraged traders broke.
This guide explains the exact mechanical chain connecting the U.S. Consumer Price Index (CPI), Federal Reserve interest rates, Treasury bond yields, the U.S. dollar, and global liquidity to the CPI Bitcoin price and the wider CPI crypto market.
| ZenvestAI Quick Answer: The U.S. Consumer Price Index (CPI) moves CPI crypto prices because it directly dictates whether the Federal Reserve injects cheap dollar liquidity into financial markets or drains capital away through higher interest rates and rising bond yields. Why Does This Matter Right Now (October 2026 Context): On October 14, 2026, the U.S. Bureau of Labor Statistics (BLS) September 2026 CPI Release reported that headline Consumer Price Index for All Urban Consumers (CPI-U) jumped 0.6% month-over-month and accelerated to 3.7% year-over-year (up from 3.4% in August), driven by a 9.1% monthly spike in gasoline and a 3.2% annual rise in shelter. Core CPI (excluding food and energy) rose 0.3% month-over-month and 2.6% year-over-year. Coming just four weeks after the Federal Reserve FOMC raised the federal funds target range by 25 basis points to 3.75%–4.00% on September 16–17, 2026, that hotter-than-expected inflation print knocked Bitcoin below the $83,000 threshold within hours. What You Will Learn in This Guide: You will master what #CPIWatch means, why decentralized crypto tracks U.S. inflation, the six-step transmission pipeline (Fed CPI policy → Treasury yields → DXY → global liquidity → Bitcoin → altcoins), how to read hot, cool, and in-line scenarios, why Bitcoin sometimes defies the textbook reaction, and a complete step-by-step Practical CPI Research Framework with real mathematical verification for decentralized exchange slippage and net yields. |
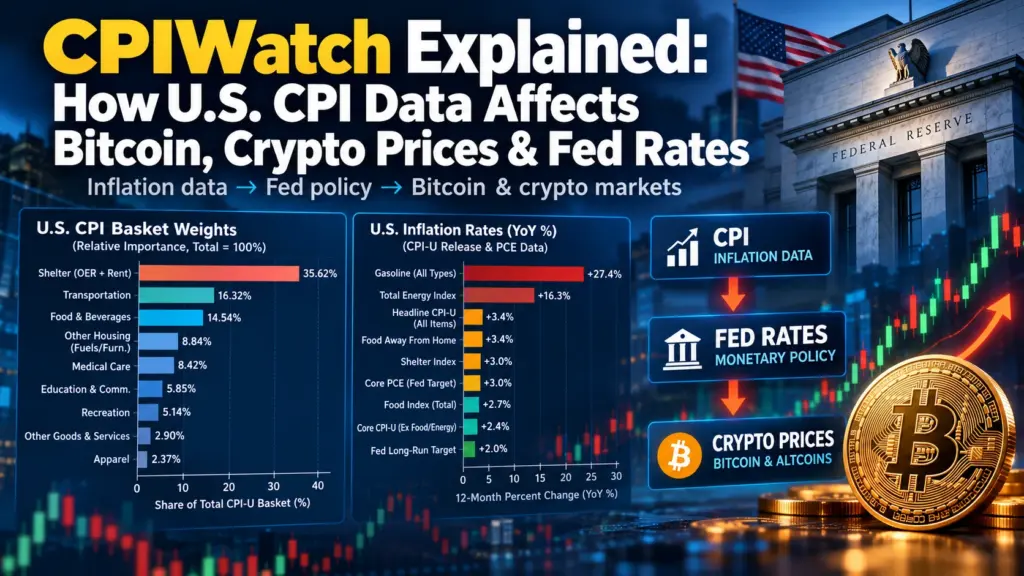
Table of Contents
- 1. What Is #CPIWatch and Why Does One Morning Report Freeze the Entire Crypto Market?
- 2. Why Do Crypto Traders Watch U.S. CPI So Closely When Bitcoin Is Decentralized?
- 3. How Does CPI Shape Federal Reserve Decisions and Interest Rates (CPI → Fed → Rates)?
- 4. How Does CPI Move U.S. Treasury Yields and Compete With Crypto Returns (CPI → Yields)?
- 5. How Does CPI Drive the U.S. Dollar Index and Denominator Pressure (CPI → DXY)?
- 6. How Does CPI Shift Global Liquidity and Overall Financial Conditions (CPI → Liquidity)?
- 7. How Does CPI Affect Bitcoin Price Discovery and Institutional Flows (CPI → Bitcoin)?
- 8. Why Do Altcoins React More Violently Than Bitcoin to CPI Surprises (CPI → Altcoins)?
- 9. What Happens in a Hotter-Than-Expected CPI Scenario?
- 10. What Happens in a Cooler-Than-Expected CPI Scenario?
- 11. What Happens in an In-Line CPI Scenario?
- 12. Why Doesn’t CPI Always Move Bitcoin as Expected? (Theory vs. Real-World Failure)
- 13. How Can You Prepare Your Portfolio Before a CPI Release?
- 14. What Are the Biggest CPI Trading Mistakes That Wipe Out Retail Accounts?
- 15. Your Step-by-Step #CPIWatch Operating Manual
- Frequently Asked Questions (FAQs) About #CPIWatch and Crypto
- Related Intelligence & Websites from where Data Taken For this Article
- Author / Editorial Information
- Global Regulatory & Educational Disclosure
1. What Is #CPIWatch and Why Does One Morning Report Freeze the Entire Crypto Market?
#CPIWatch is the global financial community’s monthly real-time tracking event surrounding the release of the U.S. Consumer Price Index by the U.S. Bureau of Labor Statistics (BLS) at 8:30 a.m. Eastern Time.
Across crypto trading desks from New York and London to Singapore and Mumbai, #CPIWatch serves as a shorthand coordination signal that volatility is about to spike, orderbook depth is about to thin out, and automated trading algorithms are preparing to reprice every risk asset on earth.
The report at the center of #CPIWatch measures the average change over time in the prices paid by urban American households for a fixed basket of everyday goods and services.
According to the BLS September 2026 CPI Technical Note, trained government representatives collect prices each month across 75 urban areas from approximately 6,000 housing units and 22,000 retail establishments (including supermarkets, gas stations, hospitals, and department stores), covering the CPI-U population that represents over 90% of the total U.S. population.
You can divide the CPI report into two primary headline numbers and three internal drivers during every #CPIWatch broadcast:
- Headline CPI (CPI-U All Items): Tracks the complete basket of consumer goods and services, including volatile food and energy costs; in September 2026, headline CPI rose 0.6% month-over-month and 3.7% year-over-year (BLS Summary).
- Core CPI (All Items Less Food and Energy): Strips out grocery and fuel swings to reveal underlying inflation stickiness across rent, healthcare, insurance, and recreation; in September 2026, Core CPI increased 0.3% month-over-month and 2.6% year-over-year (BLS Table A).
- Shelter and Core Services (The Sticky Core): Measures housing rents, Owners’ Equivalent Rent (OER), and labor-intensive services; in September 2026, shelter climbed 0.4% month-over-month (3.2% year-over-year) while services less energy services rose 0.4% month-over-month (3.1% year-over-year), proving why central bankers rarely relax after a single cool month (BLS Table A).
Now that you know what the government measures inside the CPI basket, a natural question arises—if Bitcoin was built as an independent, borderless currency outside government control, why do crypto traders care so much about U.S. grocery and rent prices?
2. Why Do Crypto Traders Watch U.S. CPI So Closely When Bitcoin Is Decentralized?
Crypto traders watch U.S. CPI religiously because while the Bitcoin blockchain is decentralized, the capital that buys and sells CPI Bitcoin is overwhelmingly denominated in U.S. dollars and managed by macro-sensitive institutions.
Over 80% of global cryptocurrency spot and perpetual futures volume trades against USD or USD-pegged stablecoins like USDT and USDC, meaning any shock to the purchasing power or borrowing cost of the dollar immediately alters crypto buying power.
The institutionalization of digital assets through U.S. spot exchange-traded products (SEC Investor Bulletin on Spot Bitcoin & Ether ETPs) permanently fused Wall Street macro desks with crypto orderbooks.
Hedge funds, pension allocators, and corporate treasuries do not evaluate Bitcoin in a vacuum; they weigh CPI Bitcoin price volatility against the risk-free yield they can earn in U.S. Treasury bills and the cost of borrowing dollars on margin.
Furthermore, the CPI crypto market trades 24/7 with deep perpetual futures leverage and instant settlement. When a surprise inflation print hits the wires at 8:30 a.m. ET—one full hour before the New York Stock Exchange opening bell—Bitcoin and Ether act as the world’s fastest, most liquid pressure valve for institutional macro repricing.
Knowing that institutional dollar flows link CPI to crypto is the starting point, but how does an inflation percentage actually force the Federal Reserve's hand on interest rates? Let's trace the first link in the chain.
3. How Does CPI Shape Federal Reserve Decisions and Interest Rates (CPI → Fed → Rates)?
The Fed CPI transmission link begins with the Federal Reserve’s dual mandate from Congress: maintaining maximum employment and keeping consumer price inflation stable near its 2.0% longer-run annual target (Federal Reserve FOMC Overview).
Whenever CPI inflation accelerates well above 2%, the Federal Open Market Committee (FOMC) is forced to tighten monetary policy by raising the target range for the federal funds rate—the overnight interest rate at which commercial banks lend reserve balances to one another.
Real-world policy shifts in 2025 and 2026 illustrate how quickly the Federal Reserve pivots when inflation refuses to stay down. According to the Federal Reserve Open Market Operations Rate History, after cutting the federal funds target range three times in late 2025 down to 3.50%–3.75%, resurgent inflation forced the FOMC on September 16–17, 2026 to reverse course and hike the target range by 25 basis points back to 3.75%–4.00%.
Crypto markets do not wait six weeks for the official FOMC meeting to react to a CPI release. Within milliseconds of the 8:30 a.m. ET BLS print, institutional futures traders reprice 30-Day Federal Funds futures on the Chicago Mercantile Exchange, which you can track live using the CME FedWatch Tool. For example, following the August 2026 CPI release in mid-September, implied CME FedWatch rate-hike odds surged from 58% to 88% almost overnight (CoinMarketCap Macro Analysis), immediately repricing risk assets before the Fed Chair ever stepped up to a microphone.
Once traders update their Federal Reserve rate expectations on CME FedWatch, where does that repricing show up in real capital markets? It hits the U.S. Treasury bond market next.
4. How Does CPI Move U.S. Treasury Yields and Compete With Crypto Returns (CPI → Yields)?
U.S. Treasury yields represent the return investors demand to lend money to the U.S. government across different maturities, tracked daily in the Federal Reserve H.15 Selected Interest Rates Release.
When CPI comes in hotter than expected, bond investors demand higher yields for two reasons: first, to compensate for inflation eroding the purchasing power of fixed coupon payments, and second, because they expect the Federal Reserve to keep short-term policy rates higher for longer.
Two specific points on the U.S. Treasury Yield Curve act as direct gravity wells on the CPI Bitcoin price:
- The 2-Year Treasury Yield: Serves as the market’s most sensitive barometer for where the FOMC will set the federal funds rate over the next 8 to 16 meetings.
- The 10-Year Treasury Yield (FRED DGS10 Series) and 10-Year Real Yield (FRED DFII10 TIPS Series): Serve as the global benchmark ‘hurdle rate’ used by institutional portfolio managers to value every long-duration asset, from technology stocks to Bitcoin and decentralized finance protocols.
According to the September 15–16, 2026 FOMC Minutes, nominal Treasury yields across the 2-year to 10-year segment jumped roughly 35 basis points (0.35%) over a single intermeeting period as persistent inflation collided with heavy corporate bond issuance from artificial intelligence (AI) hyperscalers competing for capital. Because Bitcoin pays zero native coupon or dividend, every 35-basis-point surge in risk-free Treasury yields raises the opportunity cost of holding non-yielding digital assets, prompting conservative allocators to rotate out of CPI crypto positions and into government bonds.
As U.S. Treasury yields climb and offer higher risk-free returns than foreign bonds, global capital rushes into American debt—which immediately triggers the next link in our chain: the U.S. Dollar Index (DXY).
5. How Does CPI Drive the U.S. Dollar Index and Denominator Pressure (CPI → DXY)?
The U.S. Dollar Index (DXY)—alongside the Federal Reserve’s Nominal Broad U.S. Dollar Index on FRED—measures the exchange-rate strength of the U.S. dollar against a basket of major foreign currencies including the Euro, Japanese Yen, British Pound, and Canadian Dollar. When a hot U.S. CPI report pushes American interest rates and Treasury yields above those of Europe or Asia, international capital flows into U.S. dollar assets to capture that yield advantage, bidding up the dollar.
For a crypto investor, a surging dollar creates an automatic headwind known as denominator pressure. Because the global market quotes CPI Bitcoin as BTC/USD, a rising USD denominator mathematically pushes the quoted dollar price of Bitcoin downward even if global demand for Bitcoin stays completely flat.
More importantly, developing economies and offshore corporate borrowers hold trillions of dollars in USD-denominated debt; when a hot CPI print strengthens the dollar, servicing that debt becomes more expensive, forcing global funds to sell liquid assets like Bitcoin and Ether to raise cash.
Conversely, as noted in the September 2026 FOMC Minutes, when foreign central banks hike rates faster than the Fed or when coordinated currency interventions occur (such as the late-July 2026 U.S.–Japan yen intervention), the dollar weakens—providing an immediate tailwind that buoys dollar-denominated crypto prices.
Interest rates, bond yields, and dollar strength all converge into one master variable that actually moves Bitcoin's market cap: how much spendable cash is sloshing around the financial system. Let's examine how CPI shifts global liquidity.
6. How Does CPI Shift Global Liquidity and Overall Financial Conditions (CPI → Liquidity)?
Liquidity is the lifeblood of the CPI crypto market, representing the total pool of readily available cash and credit that banks, funds, and retail investors can deploy into risk assets. While retail traders focus solely on whether the Fed hikes or cuts rates by 25 basis points, institutional analysts track three plumbing pipes inside the Federal Reserve’s balance sheet and money markets (Federal Reserve Open Market Operations):
- Commercial Bank Reserve Balances & Reserve Management Purchases (RMPs): When inflation stays hot, the Fed keeps bank reserves tight; in the September 2026 FOMC Minutes, the New York Fed Open Market Desk confirmed it paused Reserve Management Purchases (RMPs) while monitoring whether bank reserves remained ample.
- Overnight Reverse Repurchase Agreements (ON RRP) & Money Market Rates: Money market funds park cash at the Fed’s ON RRP facility; in September 2026, the Effective Federal Funds Rate (EFFR) traded 2 basis points below the Interest on Reserve Balances (IORB) rate while the Tri-Party General Collateral Rate averaged 3 basis points below IORB, showing how money markets absorb heavy Treasury bill issuance (September 2026 FOMC Minutes).
- The U.S. Treasury General Account (TGA) & Debt Buybacks: When the U.S. Treasury spends down its cash checking account (the TGA) or conducts bond buybacks to cap long-term yields, it injects liquidity back into private bank accounts—offsetting some of the drag from high interest rates (CoinMarketCap Macro Analysis).
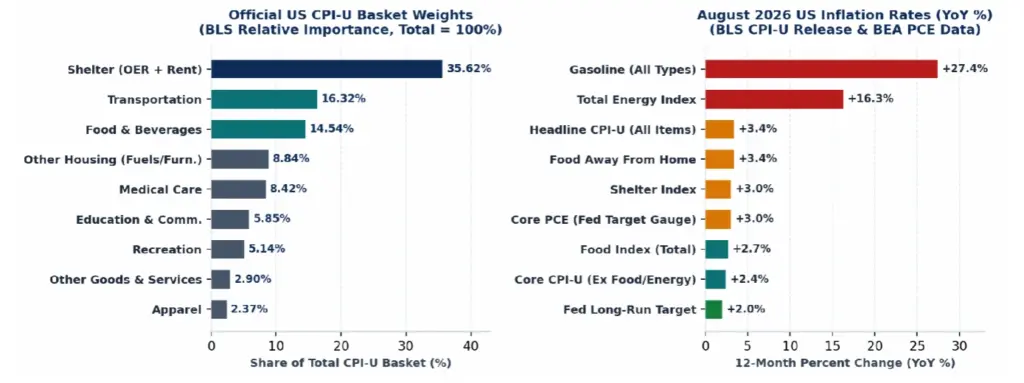
In the above figure: Left — U.S. CPI-U Headline vs. Core Monthly Trajectory (Mar–Sep 2026, U.S. Bureau of Labor Statistics). Right — The 6-Stage #CPIWatch Macro-to-Crypto Transmission Architecture.
Now that all four macro gears—Fed rates, Treasury yields, DXY, and system liquidity—are connected, how do they specifically strike Bitcoin’s orderbooks at 8:30 a.m. ET?
7. How Does CPI Affect Bitcoin Price Discovery and Institutional Flows (CPI → Bitcoin)?
CPI Bitcoin price discovery operates under a dual identity: over a multi-year horizon, investors view Bitcoin’s fixed 21-million supply cap as a digital hedge against monetary debasement, but over a 24-hour to 30-day trading window, Bitcoin trades as a high-liquidity barometer of dollar financial conditions. When CPI surprises to the upside, the immediate tightening of financial conditions almost always overrides the long-term inflation-hedge narrative during the initial trading session.
In the modern market structure, a CPI release hits CPI Bitcoin through two distinct channels within hours of each other:
- Channel 1 — Instantaneous Perpetual Futures Repricing (8:30 a.m. to 9:30 a.m. ET): High-frequency algorithms parse the BLS headline and Core CPI numbers in under 50 milliseconds, sweeping thin orderbooks on offshore and regulated futures exchanges and triggering stop-losses and leveraged liquidations.
- Channel 2 — U.S. Spot Bitcoin ETF Capital Flows (9:30 a.m. to 4:00 p.m. ET): Once U.S. equity markets open, institutional allocators adjust their holdings in spot Bitcoin exchange-traded products; for instance, during October 2026 inflation jitters, U.S. spot Bitcoin funds recorded roughly $452 million in outflows even as spot buyers defended the $81,500–$83,000 support zone (CoinMarketCap Market Data, Investing.com BTC Report).
If Bitcoin moves 2% to 5% on a CPI surprise, why do smaller tokens routinely swing 10% to 20% on the exact same report? Let's look at how the shockwave hits altcoins.
8. Why Do Altcoins React More Violently Than Bitcoin to CPI Surprises (CPI → Altcoins)?
Altcoins—ranging from smart-contract leaders like Ethereum and Solana to decentralized finance (DeFi) governance tokens and AI-compute protocols—sit at the far end of the financial risk curve. Because altcoins have smaller market capitalizations, shallower orderbook depth, and higher retail perpetual futures leverage than Bitcoin, they exhibit a high-beta relationship (typically 1.5x to 3.0x Bitcoin’s percentage move) during #CPIWatch volatility.
Three structural mechanisms explain why altcoins suffer disproportionate drawdowns on hot CPI prints and explosive rallies on cool CPI prints:
- Thinner Market Maker Depth: Prior to 8:30 a.m. ET, automated market makers widen their bid-ask spreads and pull resting limit orders from altcoin books to avoid toxic arbitrage flow, meaning a modest wave of market sell orders can drop an altcoin’s price by 8% to 12% in minutes.
- Bitcoin Dominance (BTC.D) Flight to Safety: When macro uncertainty rises after a hot CPI print, crypto funds rarely exit to fiat all at once; instead, they rotate out of illiquid altcoins into Bitcoin and stablecoins first, causing
ALT/BTCtrading pairs to bleed alongsideALT/USD. - DeFi Yield Compression vs. Treasury Hurdle Rates: When a hot CPI print pushes risk-free U.S. Treasury yields above 4.0%, on-chain DeFi lending protocols paying 3.5% to 4.5% gross stablecoin yield lose their competitive edge once smart contract risk and gas fees are deducted, prompting capital flight from altcoin ecosystems.
Having mapped the entire transmission pipeline from BLS data to Bitcoin and altcoins, how do the three specific CPI outcomes—hotter, cooler, and in-line—play out in real market numbers? Let's examine each scenario starting with the one traders fear most.
9. What Happens in a Hotter-Than-Expected CPI Scenario?
A hotter-than-expected CPI scenario occurs when either Headline CPI or Core CPI prints at least 0.1 percentage point (10 basis points) above the Wall Street economist consensus forecast—especially when the surprise is driven by sticky shelter or core services rather than a temporary weather blip.
We saw a textbook hotter-than-expected scenario unfold on October 14, 2026, when the BLS September 2026 CPI Report revealed that monthly headline inflation accelerated to 0.6% month-over-month (up from 0.4% in August) and 3.7% year-over-year (up from 3.4% in August), fueled by a 9.1% monthly surge in gasoline prices and a 0.4% rise in shelter.
In reaction to the hotter print, Bitcoin slipped below $83,000 as traders priced out near-term rate relief and braced for the Federal Reserve to hold its 3.75%–4.00% policy rate or tighten further. Similarly, during an earlier hot inflation surprise when monthly CPI printed 0.4% and pushed annual inflation to 3.2% against a 3.1% forecast, Bitcoin dropped 5% from $73,005 toward $71,000 as rate-cut odds evaporated.
If a hot CPI print drains liquidity and knocks Bitcoin down, what happens when inflation cools faster than Wall Street expects? Let's look at the upside scenario.
10. What Happens in a Cooler-Than-Expected CPI Scenario?
A cooler-than-expected CPI scenario occurs when Headline CPI and Core CPI print 0.1 percentage point or more below consensus, signaling that disinflation is gaining traction and giving the Federal Reserve room to pause rate hikes or cut the federal funds rate.
In a cool CPI release, the 6-stage transmission chain runs in reverse: CME FedWatch rate-cut probabilities jump, 2-year and 10-year Treasury yields drop sharply, the U.S. Dollar Index (DXY) softens, and institutional capital rushes back into spot Bitcoin ETFs and digital assets.
As documented in CoinMarketCap’s Cooling U.S. Inflation Analysis, when Core CPI recorded its first deceleration in months alongside steady headline inflation, risk appetite surged across equities and crypto, propelling Bitcoin across major psychological milestones as short sellers were forced to cover.
Hot and cool surprises grab the biggest headlines, yet roughly half of all CPI releases match economist forecasts to the exact decimal. What happens to Bitcoin when CPI lands right in line?
11. What Happens in an In-Line CPI Scenario?
An in-line CPI scenario occurs when both monthly and annual Headline and Core CPI match the consensus forecast—a setup that often produces a violent ‘both-sides liquidity sweep’ before leaving Bitcoin near where it started.
Why does an in-line print still cause an 8:30 a.m. ET spike in both directions? Leading into #CPIWatch, aggressive speculators build crowded leveraged long and short positions betting on an inflation surprise, while options traders pay high implied volatility premiums for straddles.
When the number prints exactly in line—as seen when annual CPI matched forecasts at 2.9% and Bitcoin held steady around its $114,000 benchmark—options implied volatility collapses immediately (‘vol crush’), market makers hunt nearby stop-loss clusters 1% above and below spot price within the first five minutes, and the market then reverts to its pre-existing trend.
| CPI Scenario | Typical BLS Data Trigger | Fed, Yields & DXY Reaction | Bitcoin & Altcoin Market Impact | Verified Real-World Case Study |
| Hotter-Than-Expected | Headline or Core MoM ≥ +0.1% above consensus; sticky shelter (+0.4% MoM) or energy shock (+5.2% MoM). | FOMC hike odds rise; 2Y & 10Y Treasury yields spike; DXY strengthens. | Immediate futures sell-off; long liquidations; altcoins underperform BTC by 1.5x–3x. | Oct 14, 2026 (Sep CPI): Headline +0.6% MoM / +3.7% YoY; BTC dipped below $83,000. |
| Cooler-Than-Expected | Core CPI MoM ≤ -0.1% below consensus; decelerating shelter and services inflation. | CME FedWatch rate-cut odds jump; Treasury yields drop; DXY weakens. | Short squeeze across BTC perpetuals; strong Spot ETF net inflows; high-beta altcoins surge. | Cooling Core CPI Print: First Core CPI drop sparked ETF inflows and pushed BTC across $100K. |
| In-Line With Consensus | Headline and Core MoM/YoY match Wall Street median estimates to the tenth of a percent. | Fed policy path unchanged; minor yield drift; options implied volatility crushes. | 2-way stop-hunt wick at 8:30 a.m. ET followed by range retention and trend continuation. | In-Line 2.9% YoY CPI Print: Matched forecast; BTC absorbed initial wick and held $114,000. |
The three scenarios above make intuitive sense on paper—so why have you probably seen days where CPI came in hot and Bitcoin rallied anyway, or CPI came in cool and Bitcoin dumped? Let's unpack why textbook theory sometimes fails in the real world.
12. Why Doesn’t CPI Always Move Bitcoin as Expected? (Theory vs. Real-World Failure)
Even seasoned macro traders get humbled when CPI Bitcoin price action moves in the exact opposite direction of the headline inflation number. In financial markets, price does not react to data in isolation; price reacts to data relative to existing market positioning, hidden fiscal liquidity flows, and internal sub-index divergences.
Consider the real-world failure of textbook macro theory following the August 2026 CPI release on September 11, 2026 (CoinMarketCap Orderbook & Macro Case Study).
In that report, monthly CPI rose 0.4% (and 3.4% year-over-year), while Core CPI rose 0.3%—pushing CME Group Fed rate-hike odds from 58% to 88% ahead of the September 15–16 FOMC meeting.
By textbook rules, an 88% probability of a Fed rate hike should have crushed Bitcoin immediately; instead, Bitcoin rallied sharply toward $80,000 right after the print before stalling in the $80,000 to $82,300 zone.
Four real-world forces explain why Bitcoin frequently defies the surface-level CPI number:
- 1. The ‘Debasement Trade’ & Treasury Liquidity Offsets: During the September 2026 CPI reaction, U.S. Treasury commitments to buy back 10-year to 30-year bonds and tap the Treasury General Account (TGA) to stabilize yields convinced investors that fiscal authorities were engaging in de-facto yield-curve control, fueling a rush into gold and Bitcoin (CoinMarketCap Analysis).
- 2. Crowded Pre-Release Positioning & Liquidation Heatmaps: If traders are heavily net-short going into 8:30 a.m. ET expecting a terrible CPI number, a merely moderately hot print forces shorts to cover; conversely, in mid-September 2026, Bitcoin’s rally stopped dead at $80,000 because long breakeven exits from $68,000–$79,000 collided with a dense wall of net shorts defending $79,000–$80,900 (CoinMarketCap Hyblock Orderbook Data).
- 3. Headline vs. Core Divergence: In September 2026 (BLS Release), Headline CPI surged 0.6% MoM mostly because gasoline spiked 9.1% MoM, whereas Core CPI rose a steadier 0.3% MoM (2.6% YoY). Institutional algorithms weight Core CPI and Supercore services far more heavily than temporary gasoline swings.
- 4. Institutional Spot ETF Buffers: As demonstrated during earlier hot CPI prints (CoinMarketCap ETF Flow Report), when weekly inflows into spot Bitcoin ETFs (such as BlackRock’s iShares Bitcoin Trust and Fidelity’s Wise Origin Bitcoin Fund) reach $3.68 billion, steady institutional spot buying absorbs futures panic selling within hours.
Seeing how easily orderbook walls and hidden liquidity flows can trap knee-jerk traders, how should you actually prepare your portfolio in the 24 hours before the BLS clock strikes 8:30 a.m. ET?
13. How Can You Prepare Your Portfolio Before a CPI Release?
Preparing for #CPIWatch happens the afternoon before the release, never at 8:29 a.m. ET when spreads are already widening and emotions are running high. Professional crypto desk managers follow a four-part pre-release checklist before every monthly CPI print (such as the upcoming October 2026 CPI release scheduled by the U.S. Bureau of Labor Statistics for Tuesday, November 10, 2026, at 8:30 a.m. ET):
- Write Down Both Consensus Numbers (MoM and YoY for Headline and Core): Never watch only the annual percentage; write down the exact consensus tenths-of-a-percent for both Headline MoM and Core MoM so you can spot a divergence immediately.
- Audit Your Portfolio Leverage and Liquidation Distance: Reduce perpetual futures leverage or switch to spot holdings at least 12 hours before the release; a standard 8:30 a.m. ET ‘Darth Maul’ candle routinely wicks 2.5% to 4.0% in both directions within 180 seconds, wiping out anyone using 15x–25x leverage.
- Map Liquidation Clusters and Orderbook Shelves: Identify where leveraged longs and shorts are clustered above and below spot price (for example, the $74,000–$76,000 long liquidity cluster vs. the $80,000–$86,000 short liquidation zone highlighted in CoinMarketCap’s Glassnode & Hyblock Review).
- Wait for the 9:30 a.m. ET U.S. Cash Open Confirmation: Let the initial 8:30 a.m. ET algorithmic fistfight settle, watch whether 2-year and 10-year Treasury yields confirm the move, and wait for 9:30 a.m. ET U.S. equity and Spot Bitcoin ETF volume to establish the true daily trend.
Knowing what to do beforehand protects your capital, but what specific behavioral and execution traps still destroy retail crypto accounts on CPI morning? Let's expose the most common mistakes.
14. What Are the Biggest CPI Trading Mistakes That Wipe Out Retail Accounts?
Most retail losses during #CPIWatch do not happen because the trader misread the direction of inflation; they happen because the trader misunderstood market microstructure during a high-velocity news event.
- Mistake 1 — Market-Ordering Into the 8:30:05 a.m. ET First-Minute Candle: Clicking ‘Market Buy’ or ‘Market Sell’ seconds after a social media headline guarantees you execute at the worst possible price inside a vacuumed orderbook, often seconds before the initial wick reverses 180 degrees.
- Mistake 2 — Trading the Headline Number While Ignoring Core CPI and Shelter: When September 2026 Headline CPI jumped 0.6% MoM on a 9.1% gasoline spike while Core CPI stayed at 0.3% MoM (BLS Data), traders who panicked solely over the energy-driven headline missed that the Federal Reserve focuses primarily on core services and shelter.
- Mistake 3 — Placing Tight Stop-Losses Right Under Obvious Support Levels: Market makers can see resting stop-loss liquidity clusters just below round numbers; placing a stop 0.8% below spot price at 8:29 a.m. ET turns your position into exit liquidity for institutional limit orders.
- Mistake 4 — Ignoring Statistical Sampling Error and Chasing Unverified Social Feeds: As the BLS CPI Technical Note explicitly warns, the 1-month percent change in all-items CPI carries a 0.04% standard error (a 95% confidence interval of ±0.08%), meaning a 0.1% surprise can partly reflect statistical sampling variance—and trading off unverified social media rumors instead of the official
bls.govrelease table is a recipe for disaster.
To make sure you never fall into those four traps, how can you combine everything we have covered into a repeatable, step-by-step operating manual for every CPI release? Below is the complete ZenvestAI Practical CPI Research Framework.
15. Your Step-by-Step #CPIWatch Operating Manual
This section provides the complete ZenvestAI step-by-step operating architecture so you can analyze, verify, and execute around any U.S. CPI release with institutional discipline. Every step below answers the core operational question: What should I do now?
Problem
Retail crypto investors routinely lose between 3% and 15% of their portfolio value on CPI release days because they react emotionally to social media headlines at 8:30 a.m. ET, ignore Core CPI and bond yield confirmation, and fail to calculate hidden execution costs such as perpetual funding fees, decentralized exchange (DEX) price impact, and gas spikes.
ZenvestAI Quick Answer
Do not trade during the first 15 minutes after the 8:30 a.m. ET BLS CPI release. Instead, record the consensus forecast 24 hours in advance, compare the actual Core CPI MoM and Shelter numbers against consensus at 8:30 a.m. ET, verify that the 10-Year U.S. Treasury Yield and CME FedWatch probabilities move in the same direction between 8:30 a.m. and 9:30 a.m. ET, and execute only with limit orders after the 9:30 a.m. ET U.S. cash and Spot ETF open.
What You Need
- Official BLS Release Page: Bookmark BLS CPI Summary Table A (
bls.gov/news.release/cpi.nr0.htm) and the BLS Release Schedule (bls.gov/schedule/news_release/cpi.htm). - Rate & Yield Monitors: Open the CME FedWatch Tool Guide, the Federal Reserve H.15 Daily Interest Rates Page, and the FRED 10-Year Treasury Yield (
DGS10). - Crypto Market & Orderbook Terminal: Keep a live spot chart (CoinDesk Bitcoin Price Index) open alongside your exchange limit-order interface.
Before You Start
What should I do now? Twenty-four hours before the CPI release (for example, on Monday, November 9, 2026, ahead of the November 10, 2026 BLS release), write down the four consensus forecast numbers—Headline CPI MoM, Headline CPI YoY, Core CPI MoM, and Core CPI YoY—and close or deleverage any high-margin perpetual futures positions down to spot or low-leverage levels (≤ 2x).
Step 1: Audit Table A of the Official BLS Release at 8:30 a.m. ET
What should I do now? At 8:30:00 a.m. ET, refresh BLS CPI Summary (bls.gov/news.release/cpi.nr0.htm) and read Table A directly rather than relying on social media posts. Compare All items (MoM and YoY) against All items less food and energy (Core CPI) and check whether the move was driven by volatile Energy/Gasoline (+9.1% MoM in Sep 2026) or sticky Shelter (+0.4% MoM in Sep 2026).
Step 2: Check Cross-Market Confirmation in Yields, DXY, and CME FedWatch (8:35 a.m. – 9:15 a.m. ET)
What should I do now? Wait 15 to 45 minutes and observe whether traditional macro markets confirm the CPI print. If CPI was hot (+0.1% or more above forecast), confirm that 2-year and 10-Year Treasury Yields are rising and stay elevated; if Bitcoin spikes upward while Treasury yields and CME FedWatch hike odds are also rising, recognize it as a likely pre-market stop-hunt trap.
Step 3: Observe the 9:30 a.m. ET U.S. Cash Equity and Spot ETF Open
What should I do now? At 9:30 a.m. ET, watch the first 30 minutes of U.S. equity and Spot Bitcoin ETP trading. Verify whether institutional spot volume absorbs the 8:30 a.m. futures move or accelerates it, and map the post-release high and low of the first hour (8:30 a.m. – 9:30 a.m. ET Opening Range).
Step 4: Execute Using Limit Orders Outside the Initial Volatility Wick
What should I do now? After 10:00 a.m. ET, place resting limit orders (never market orders) either on a confirmed breakout retest of the 8:30–9:30 a.m. ET range or at pre-identified institutional support shelves (such as the $81,500–$83,000 or $74,000–$76,000 spot demand zones), sizing your risk so that a stop-loss invalidation costs no more than 1.0% to 1.5% of total portfolio equity.
Security / Safety
What should I do now? Protect your capital against exchange outages and custody risks during extreme #CPIWatch traffic spikes. Review the U.S. SEC Investor Bulletin on Crypto Asset Custody Basics: keep long-term holdings in self-custody hardware wallets, never leave excess margin collateral sitting on a single trading venue, and use hard stop-limit or guaranteed stop orders rather than mental stops when volatility surges.
Costs: Separating Gross Returns From Net Reality & Verifying the Constant-Product Formula
What should I do now? Before executing any on-chain swap or yield rebalance during a CPI volatility spike, calculate your net reality after slippage, gas fees, divergence (impermanent loss), and smart contract risks. Displayed DeFi protocol yields never account for what happens when an 8:30 a.m. ET CPI candle drains liquidity pool reserves.
To verify the exact mathematical cost of trading on an Automated Market Maker (AMM) decentralized exchange during a CPI liquidity crunch, run your order through the constant-product formula (x * y = k, where x is the WBTC reserve, y is the USDC reserve, and k is the constant product):
| Verified Constant-Product AMM Math Scenario (x * y = k Precision Check) Pool State Before 8:30 a.m. ET CPI Release: Suppose an on-chain WBTC/USDC liquidity pool holds x = 100 WBTC and y = 8,300,000 USDC (reflecting the October 14, 2026 spot price of $83,000 per BTC). The constant product is k = 100 × 8,300,000 = 830,000,000. Execution Scenario A (Deep Pre-News Liquidity — Swapping 2 WBTC for USDC with 0.30% LP Fee): After the 0.30% protocol fee ( 2 × 0.997 = 1.994 WBTC effective input), the new WBTC reserve is x' = 100 + 1.994 = 101.994 WBTC. By y' = k / x', the new USDC reserve is 830,000,000 / 101.994 = 8,137,733.59 USDC. You receive y - y' = 162,266.41 USDC (an effective price of $81,133.21/BTC, or 2.25% total cost combining 1.95% price impact and 0.30% fee). Execution Scenario B (8:30 a.m. ET CPI Liquidity Withdrawal — 60% of LPs Pull Liquidity): During the CPI release, liquidity providers withdraw 60% of depth to avoid toxic arbitrage, shrinking the pool at the same $83,000 mid-price to x = 40 WBTC and y = 3,320,000 USDC (k = 132,800,000). Selling the exact same 2 WBTC ( 1.994 WBTC after the 0.30% fee) pushes x' = 41.994 WBTC and y' = 132,800,000 / 41.994 = 3,162,356.53 USDC. You receive only 157,643.47 USDC ($78,821.73/BTC)—a 5.03% slippage and fee loss ($8,356.53 lost on a $166,000 trade) before even subtracting priority L1 gas fees ($15–$85 during congestion). Separating Gross Yield from Net Reality for Liquidity Providers: Even if that AMM pool advertises 18% APY gross trading fees, a 5% post-CPI BTC price drop creates immediate divergence (impermanent loss) of 2 × sqrt(0.95) / (1 + 0.95) - 1 = -0.0329% per shock, plus gas rebalancing costs and smart contract exploit exposure—turning headline gross yield into negative net reality for short-term LPs. |
Common Mistakes
What should I do now? Before clicking submit on any CPI-day trade, run a 10-second pre-flight check to confirm you are not committing one of the four fatal errors: (1) entering during the 8:30–8:45 a.m. ET spread blowout, (2) ignoring the Core CPI vs. Headline CPI breakdown, (3) setting stops inside obvious liquidation heatmaps, or (4) trading with high leverage when funding rates are skewed.
Troubleshooting
What should I do now? Use these immediate recovery actions when market conditions break down during #CPIWatch:
- If Your Exchange Freezes or Rejects Orders at 8:30 a.m. ET: Do not repeatedly click ‘Market Buy/Sell’ (which can queue duplicate fills once the matching engine catches up); switch to your secondary venue or wait for the orderbook to stabilize before placing a single limit order.
- If Headline CPI Is Hot (+0.6% MoM) Carry-Driven by Gasoline (+9.1% MoM) While Core CPI Is Steady (+0.3% MoM): Do not chase the initial panic dump; check whether 2-year Treasury yields fail to make a new high, which signals that institutional desks are fading the energy-distorted headline (BLS September 2026 Data).
- If On-Chain Gas Fees and DEX Slippage Exceed 1.0%: Cancel the on-chain swap and either route through a deep centralized exchange limit orderbook or split the order into time-weighted average price (TWAP) tranches after 10:00 a.m. ET.
Alternative Methods
What should I do now? If active intraday trading around CPI does not fit your schedule or risk tolerance, choose one of three proven alternatives: (1) Time-Horizon Immunity (Dollar-Cost Averaging): Schedule automated spot Bitcoin purchases 24 hours after the monthly CPI print once volatility settles; (2) Defined-Risk Options Hedging: Buy a modest out-of-the-money put option 48 hours before CPI when implied volatility is still reasonable rather than using stop-losses that can get wicked out; or (3) Spot ETF Allocation: Use regulated spot ETPs during regular U.S. market hours (SEC ETP Investor Bulletin) to avoid 24/7 perpetual futures liquidation cascades.
Having walked through the entire step-by-step execution framework, let's address the most frequent rapid-fire questions readers ask before every monthly CPI release.
Frequently Asked Questions (FAQs) About #CPIWatch and Crypto
What time is U.S. CPI data released and when is the next #CPIWatch date?
The U.S. Bureau of Labor Statistics always releases the monthly Consumer Price Index report at 8:30 a.m. Eastern Time (ET). According to the official BLS September 2026 CPI Release and BLS Release Calendar, the next CPI report (covering October 2026 data) is scheduled for Tuesday, November 10, 2026, at 8:30 a.m. ET.
Does a higher CPI reading increase or decrease the Bitcoin price?
In the short term (minutes to days), a higher-than-expected CPI reading usually decreases the CPI Bitcoin price because it forces the Federal Reserve toward higher interest rates (such as the current 3.75%–4.00% target range set in September 2026), pushes up U.S. Treasury yields, and strengthens the U.S. dollar. Over multi-year cycles, however, persistent inflation combined with government debt monetization strengthens Bitcoin’s long-term monetary debasement thesis.
Which matters more for crypto traders: Headline CPI or Core CPI?
Core CPI (All items less food and energy) matters far more to the Federal Reserve and institutional crypto desks than Headline CPI. While Headline CPI makes splashy news when gasoline jumps 9.1% in a single month as it did in September 2026, policymakers set interest rates based on Core CPI (+0.3% MoM / +2.6% YoY in September 2026) and shelter costs (+3.2% YoY).
Why does Bitcoin sometimes pump right after CPI and then dump an hour later?
That two-stage reversal happens because the 8:30 a.m. ET move is dominated by automated futures algorithms hunting leveraged stop-losses in thin pre-market orderbooks, whereas the 9:30 a.m. ET move reflects real institutional capital flows when the New York Stock Exchange and U.S. Spot Bitcoin ETFs open for cash trading.
ZenvestAI View On: How U.S. CPI Data Affects Bitcoin, Crypto Prices & Fed Rates
Most financial websites repeat the same one-dimensional textbook slogan—’hot CPI equals rate hikes, which is bad for Bitcoin.’ At ZenvestAI, cross-referencing the deep footnotes of the October 14, 2026 BLS Technical Note with the September 15–16, 2026 Federal Reserve FOMC Minutes reveals three structural market realities that mainstream financial media completely overlook:
- 1. The AI Hyperscaler Debt Crowding-Out Effect on Crypto Valuation: The September 2026 FOMC Minutes explicitly confirmed that the 35-basis-point surge in 2-to-10-year Treasury yields was driven not only by CPI inflation, but by massive long-duration corporate bond issuance from artificial intelligence (AI) infrastructure hyperscalers competing for global capital, alongside AI buildout demand raising prices for high-tech consumer goods. That means crypto is no longer just fighting consumer grocery inflation; Bitcoin and AI-related altcoins are competing directly against trillions in AI data-center debt for institutional liquidity.
- 2. The 0.04% BLS Sampling Error vs. Billion-Dollar Liquidation Cascades: In the BLS September 2026 Technical Note, government statisticians disclose that the 1-month percent change in U.S. all-items CPI-U has a 0.04% standard error (meaning a ±0.08% 95% confidence interval across its sample of 6,000 housing units and 22,000 stores). Yet crypto perpetual futures algorithms routinely liquidate hundreds of millions of dollars in retail positions over a 0.10% consensus miss that sits barely outside statistical sampling noise.
- 3. Fiscal Dominance and the ‘Stealth Liquidity Buffer’: Even after the FOMC hiked rates to 3.75%–4.00% in September 2026 and paused Reserve Management Purchases (RMPs), U.S. Treasury bond buyback operations and TGA cash drawdowns cushioned systemic liquidity—explaining why Bitcoin held an $80,000–$83,000 floor in October 2026 where previous tightening cycles would have triggered a 40% collapse.
The Bottom Line on CPIWatch Explained: How U.S. CPI Data Affects Bitcoin, Crypto Prices & Fed Rates
| The One Thing You Should Understand After Reading This Guide U.S. CPI data does not change Bitcoin’s code, value proposition, or 21-million supply cap—it changes the short-term price and availability of the U.S. dollars used to buy Bitcoin. If you respect the 8:30 a.m. ET volatility window, focus on Core CPI and 10-year Treasury yields rather than noisy headlines, verify your net execution costs after AMM slippage and fees, and wait for 9:30 a.m. ET institutional confirmation, #CPIWatch transforms from a monthly liquidation trap into one of your clearest macro advantages. |
Related Intelligence & Websites from where Data Taken For this Article
Every statistic, policy rate, yield metric, and historical market reaction cited in this ZenvestAI research guide is grounded directly in the following primary government, central bank, regulatory, and market-data sources:
- U.S. Bureau of Labor Statistics (BLS) — September 2026 CPI News Release (Published October 14, 2026): Consumer Price Index Summary — 2026 M09 Results (
bls.gov/news.release/cpi.nr0.htm) and BLS CPI Portal (bls.gov/cpi/). - U.S. Bureau of Labor Statistics (BLS) — Official Release Calendar: Schedule of Releases for the Consumer Price Index (
bls.gov/schedule/news_release/cpi.htm). - Board of Governors of the Federal Reserve System — FOMC Policy Rate History: Open Market Operations & Target Federal Funds Rate (
federalreserve.gov/monetarypolicy/openmarket.htm). - Board of Governors of the Federal Reserve System — September 15–16, 2026 FOMC Minutes: Minutes of the Federal Open Market Committee (
federalreserve.gov/monetarypolicy/fomcminutes20260916.htm). - Federal Reserve & U.S. Treasury Yield and Dollar Benchmarks: Federal Reserve H.15 Selected Interest Rates (
federalreserve.gov/releases/h15/), U.S. Treasury Daily Interest Rate Statistics (home.treasury.gov), FRED 10-Year Constant Maturity Yield (DGS10), FRED 10-Year Inflation-Indexed Real Yield (DFII10), and FRED Nominal Broad U.S. Dollar Index. - CME Group Interest Rate Futures Methodology: CME FedWatch Tool User Guide (
cmegroup.com). - Crypto Market Reaction & On-Chain Orderbook Case Studies: Investing.com BTC Post-CPI Report (Oct 14, 2026), CoinMarketCap Academy — Bitcoin Rallies Near $80K Shelf After CPI & Orderbook Analysis, CoinMarketCap Academy — BTC Dips 5% After Hot CPI, CoinMarketCap Academy — BTC Holds $114K on In-Line CPI, and CoinDesk Bitcoin Price Index.
Author / Editorial Information
Authored By: Deepak Kumar | Last Updated: October 15, 2026 | Base Currency Standard: United States Dollar (USD)
Global Regulatory & Educational Disclosure
Mandatory Global Regulatory Disclosure (IOSCO, U.S. SEC & EU MiCA Alignment) Educational & Informational Purpose Only: This publication on ZenvestAI (zenvestai.com) is strictly an independent educational and macroeconomic research resource. All monetary figures use the United States Dollar (USD) as the primary base currency unless explicitly stated otherwise. Nothing in this document constitutes financial advice, investment advice, trading advice, portfolio management, or a solicitation or recommendation to buy, sell, or hold any crypto-asset, security, commodity, or derivative product. Global Regulatory Frameworks: In alignment with international investor-education standards established by the International Organization of Securities Commissions (IOSCO Report FR06/2024 on Investor Education on Crypto-Assets & Policy Recommendations FR11/2023), the U.S. Securities and Exchange Commission (SEC) Office of Investor Education and Advocacy Investor Alerts on Crypto Asset Risks, and the European Securities and Markets Authority (ESMA) Markets in Crypto-Assets Regulation (MiCA) Framework, ZenvestAI strictly separates objective educational explanation from regulated financial advisory or brokerage services. Digital assets are highly volatile, speculative, and may not be suitable for all investors; protections available under traditional securities or deposit-insurance regimes may not apply to crypto-asset transactions in your jurisdiction. Always conduct independent due diligence and consult a licensed financial, legal, or tax professional in your local jurisdiction before making any investment decision. |