Imagine walking into a massive financial casino where every player leaves glowing footprints leading to their exact bets. The crypto market often feels chaotic and unpredictable, but tracking options open interest (OI) provides a structural map of where heavy capital is waiting. Before making your next strategic move, you need to understand how to read these hidden market footprints and decode the real-world mechanics behind the numbers.
Crypto options open interest (OI) is the number of option contracts that remain open at a particular strike and expiry. Reading OI by strike shows where options positioning is concentrated, while reading it by expiry shows when that positioning may become relevant. However, OI alone does not reveal whether traders are net buyers or sellers, so it should be combined with volume, implied volatility, spot price, and time to expiry.
Table of Contents
- What Is Crypto Options Open Interest?
- Why Crypto Options OI Must Be Read by Strike and Expiry
- How to Read Crypto Options Open Interest by Strike
- Call Walls and Put Walls
- How to Read Crypto Options Open Interest by Expiry
- How to Combine Strike and Expiry
- How to Detect New Positioning From OI Changes
- OI + Volume: Confirming Activity
- OI + Implied Volatility
- OI + Spot Price and Strike Distance
- How to Read an Options OI Heatmap
- Worked BTC Options OI Example
- What Crypto Options OI Can Tell You
- What Crypto Options OI Cannot Tell You
- 10 Common OI Reading Mistakes
- Crypto Options OI Research Workflow
- OI vs Volume vs IV vs Max Pain vs Gamma Exposure
- Frequently Asked Questions
What Is Crypto Options Open Interest?
Open interest represents the total number of outstanding derivative contracts that have not been settled, expired, or closed. Every time a new buyer and a new seller create a contract, open interest increases by one. Conversely, when existing market participants close their positions against each other, open interest decreases.
Strike-specific OI tells analysts exactly which price levels hold the most active contracts. Expiry-specific OI reveals the exact dates when these contracts will expire, forcing decisions in the underlying market. Differentiating between calls and puts helps map out the concentration of upside exposure versus downside protection.
Understanding the difference between total trading activity and standing positions requires distinguishing between open interest and volume. Here is how key metrics interact in the derivatives market:
| Metric | What it tells you |
| Open Interest | Contracts still open and active in the market. |
| Volume | Contracts traded during a specific time period. |
| OI Change | The net change in outstanding contracts over a session. |
| Strike | The exact price level attached to the option contract. |
| Expiry | The date when the option contract terminates. |
| IV (Implied Volatility) | The market’s pricing of expected future price turbulence. |
CoinMarketCap similarly defines OI as active derivative positions that have not been closed, expired, or otherwise removed from the market. So, if we know what OI is fundamentally, why is looking at a single total number incredibly misleading?
Why Crypto Options OI Must Be Read by Strike and Expiry
Looking at total aggregate open interest is incomplete information that can lead to disastrous trading assumptions. Two different crypto markets can have identical total OI but completely different positioning structures, resulting in vastly different price dynamics. To truly understand market mechanics, you must dissect the data geometrically.
Consider Market A, which has most of its OI concentrated near the current Bitcoin (BTC) price on a large front-week expiry. Heavy concentration at several nearby strikes means the market is incredibly sensitive to short-term price swings. A sudden 5% move in spot price could trigger massive hedging obligations from market makers.
Now consider Market B, which possesses the exact same total OI, but the contracts are spread across distant strikes several months from expiry. In this scenario, immediate price action will barely register on the options market structure. The headline total OI is identical in both markets, but the structural reality is completely different.
How exactly do we break down this structure to see what the market is planning?
How to Read Crypto Options Open Interest by Strike
Evaluating OI by strike requires mapping out outstanding contracts horizontally across price levels. This process reveals the exact psychological and financial barriers market participants have built.
Current Spot Price
First, you must always identify the current BTC or ETH spot price to find your anchor. The spot price determines the At-The-Money (ATM) strike, which serves as the center point of the options chain. From the ATM strike, you then scan outward to nearby strikes, and finally to distant strikes, determining where the heaviest bets are placed relative to today’s price.
Call OI
Large call OI does not automatically mean the market is overwhelmingly bullish. A call contract can be bought for pure upside exposure, sold as a covered call to generate yield, used as part of a complex spread, or structured as a portfolio hedge. Therefore, call OI tells you exactly where call contracts are concentrated, not the complete directional intent of the market.
Put OI
Similarly, large put OI does not automatically equal an impending market crash. Puts frequently represent downside protection for large institutional portfolios, naked put selling to acquire assets at a discount, or legs of a volatility spread. Therefore, put OI should be treated as positioning concentration, not a direct sentiment indicator.
ATM, ITM and OTM
Understanding an option’s relationship to the spot price requires classifying it by moneyness. In-The-Money (ITM) options possess intrinsic value because the spot price has already crossed the strike. At-The-Money (ATM) options sit directly on the current price line. Out-of-The-Money (OTM) options hold zero intrinsic value and rely entirely on future price movement and time remaining.
OI Concentration
Identifying clusters of outstanding contracts reveals market gravity zones. When a specific strike holds a massive disproportionate share of the open interest, it indicates a price level where significant capital has been committed. CME’s OI tools similarly organize strike-level OI around the ATM strike and allow calls and puts to be examined separately.
If certain strikes accumulate massive concentrations, they form what analysts call walls. What happens when price approaches these walls?
Call Walls and Put Walls
Significant contract concentration at a single price point creates structural friction in the market, commonly referred to as walls. These levels often become psychological magnets or battlegrounds as expiry approaches.
Call Wall
A call wall is a strike price with an unusually large call OI relative to nearby strikes. This often acts as a friction point during a rally, as option sellers may sell the underlying spot asset to hedge their exposure as the price approaches the wall.
Put Wall
A put wall is a strike price with an unusually large put OI relative to nearby strikes. Historically, these areas can act as temporary floors, as market makers might buy the underlying asset to neutralize their short put exposure when the market drops toward the strike.
Why Walls Are Not Guaranteed Support or Resistance
A critical real-world failure occurs when traders treat a call wall as guaranteed resistance or a put wall as guaranteed support. If a massive put wall breaks during a violent liquidation cascade, the resulting dealer hedging can actually accelerate the downward crash rather than stopping it. Current research specifically warns against treating OI walls as automatic support or resistance because OI does not identify ownership or dealer hedge direction.
We have mapped the price levels. But when does this positioning actually matter?
How to Read Crypto Options Open Interest by Expiry
Moving from the horizontal strike dimension to the time dimension is essential because an option’s power decays every day. Never interpret strike OI without knowing exactly which expiration cycles it belongs to.
Daily
Daily expiries carry the highest immediate time sensitivity in the crypto options market. These contracts are purely tactical, meaning nearby strikes can become incredibly important for intraday volatility and immediate dealer hedging flows.
Weekly
The front-week expiry dictates short-term positioning and week-over-week market structure. As the Friday settlement approaches, the strikes with heavy OI on the weekly chain often exert gravitational pull on the spot price.
Monthly
Monthly expiries are where larger strategic positioning usually appears. Because there is more time for price and implied volatility to fluctuate, monthly chains give a clearer picture of broader macroeconomic bets and institutional portfolio hedging.
Quarterly
Quarterly expiries attract deep liquidity and represent major macroeconomic checkpoints. These chains show where the largest market participants are placing their long-horizon bets, though distant strikes may be less immediately relevant to today’s spot price.
Long-Dated
Long-dated expiries—often stretching out six to twelve months—represent structural portfolio insurance and long-term speculation. Recent educational research also emphasizes separating OI by expiry before interpreting strike concentrations, as a $120,000 BTC call expiring tomorrow means something vastly different than one expiring next December.
How do we practically merge time and price together?
How to Combine Strike and Expiry
Evaluating the options market accurately requires looking at strike and expiry simultaneously to gauge the true relevance of the outstanding contracts. OI relevance is roughly equal to Concentration multiplied by Spot proximity multiplied by Time to expiry and Market activity.
| Strike position | Expiry | What to investigate |
| Near spot | Near expiry | Potentially more immediate market sensitivity and hedging flows. |
| Near spot | Far expiry | Longer-duration positioning awaiting a major trend continuation. |
| Far OTM | Near expiry | Check whether contracts are realistically relevant or just cheap lottery tickets. |
| Far OTM | Far expiry | Often requires broader strategic context and macroeconomic analysis. |
| Large call OI | Near expiry | Examine volume, IV, and price proximity to gauge breakout potential. |
| Large put OI | Near expiry | Examine hedging context, IV, and skew to assess crash protection. |
Once you understand the current matrix, you must ask the next vital question: Is this old data, or is new money entering the market?
How to Detect New Positioning From OI Changes
Detecting fresh market conviction requires looking at the change in open interest rather than just the absolute total. The absolute OI tells you what exists, but the daily change in OI tells you what large players are doing right now.
Suppose BTC is trading at $100,000, and you are monitoring the $105,000 Call strike for a weekly expiry. Yesterday, the OI was 10,000 contracts. Today, the OI is 16,000 contracts. The OI increased by a net 6,000 contracts overnight.
That tells you that outstanding positioning increased significantly at that specific strike. However, it does not tell you whether those calls were aggressively bought by speculators or sold by yield-hunters. Therefore, to decode the intent, you must investigate the OI change alongside traded volume, the changing price of the option, IV fluctuations, and spot movement. CME’s OI tools specifically support analysis of both OI and OI change by strike and expiration.
If OI is changing rapidly, how do we confirm if the market is actually active?
OI + Volume: Confirming Activity
Combining open interest with daily trading volume filters out stale positions and highlights areas of urgent market focus. Outstanding contracts mean nothing if nobody is actively trading them.
Situation 1: High OI + low volume. Existing positioning may dominate this strike. The contracts were opened in the past, but current participants are largely ignoring this level today.
Situation 2: High OI + high volume. This indicates a highly active market around an established strike. Traders are heavily contesting this price level, constantly opening, closing, and hedging positions.
Situation 3: Rapidly rising OI + strong volume. New or renewed positioning deserves immediate investigation. Fresh capital is aggressively entering the market, signaling a potential shift in conviction.
Situation 4: Falling OI + high volume. Existing positions may be closing, taking profits, or being rolled to a future date. The high volume represents an exit rather than an entry. Remember, avoid saying exactly who is buying or selling without transaction-level evidence.
What if the market is quietly pricing in a massive surprise?
OI + Implied Volatility
Open interest tells you where contracts are concentrated, while Implied Volatility (IV) tells you how expensive the market is pricing that turbulence. Analyzing these two metrics together reveals the market’s true fear and greed.
A strike with massive OI but incredibly low IV suggests the market views that level as a standard, unthreatening friction point. However, a large OI strike that suddenly experiences an explosion in IV indicates panic or aggressive speculation. Traders are suddenly willing to pay a massive premium for those specific contracts. This creates a natural interlink to understanding how the market anticipates risk, which you can explore deeply in our guide on Implied Volatility in Crypto Options: Historical vs IV, Rank, Percentile, Smile & Skew.
How much does the actual distance from today’s price matter?
OI + Spot Price and Strike Distance
The proximity of an options cluster to the current spot price dictates its immediate impact on market liquidity. Distance from spot completely changes the mechanical behavior of the option.
Understanding moneyness—whether a contract is ITM, ATM, or OTM—is critical for risk management. A huge OI cluster resting 50% away from the spot price is not necessarily as immediately relevant as a smaller cluster sitting just 2% away. Market makers hedge aggressively when prices approach ATM strikes, but largely ignore strikes that are mathematically unreachable before expiry. This is consistent with recent research noting that contract count alone can be misleading when comparing distant versus near-spot positioning.
Is there a way to view all this data simultaneously without staring at spreadsheets?
How to Read an Options OI Heatmap
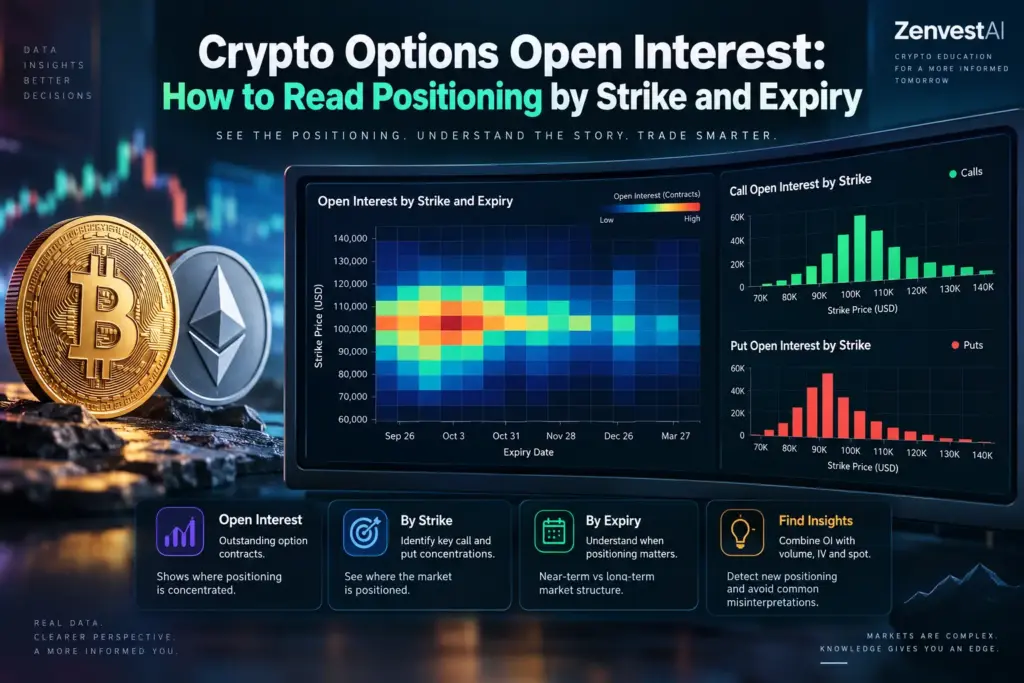
An options heat map visually translates thousands of data points into a single, color-coded topological map of market risk. Heatmaps allow traders to spot structural imbalances in seconds rather than hours.
To read a heatmap, look at the X-axis for the strike price and the Y-axis for the expiry date. The color intensity represents the sheer volume of OI concentration. By scanning this visual grid, a reader should quickly learn to identify dense concentration zones, near-expiry clusters, call-heavy areas, and put-heavy areas. You can also spot OI migration as traders roll their positions further out in time. CME’s tools similarly provide open-interest heatmaps and strike/expiration analysis for visual data digestion.
Let us test this theory with a concrete, real-world analytical scenario.
Worked BTC Options OI Example
Applying theory to raw data is the only way to build analytical intuition. Let us examine a fictional, isolated snapshot of the Bitcoin options market to practice our workflow.
Assume the BTC spot price currently sits at $100,000 USD.
| Strike | Calls OI | Puts OI | Expiry |
| $95,000 | 8,000 | 15,000 | 27 Sep |
| $100,000 | 18,000 | 16,000 | 27 Sep |
| $105,000 | 24,000 | 7,000 | 27 Sep |
| $110,000 | 30,000 | 5,000 | 27 Sep |
Walking through this data requires systematic questioning:
- Where is OI concentrated? The heaviest call concentration sits at $110,000, while the heaviest put concentration sits at $95,000.
- Which strikes are close to spot? The $100,000 strike is exactly ATM, holding a highly balanced battleground of 18,000 calls and 16,000 puts.
- Which expiry is being examined? We are looking at a September 27th expiry, meaning this is a specific, time-bound snapshot.
- Is the concentration near or far from spot? The massive 30,000 call wall at $110,000 is 10% out of the money, requiring a significant spot move to become ITM.
- What additional data is required? We need the daily trading volume and IV to see if the $110,000 calls were recently active or just stale legacy positions.
- What cannot be concluded? We cannot conclude that BTC is guaranteed to hit $110,000, nor can we guarantee that $95,000 will act as unbreakable support.
What exactly can we confidently extract from this data?
What Crypto Options OI Can Tell You
Options open interest is a structural compass, not a crystal ball. When analyzed properly, OI definitively tells you:
- Where outstanding contracts are concentrated across the price ladder.
- Which strikes possess substantial financial positioning and capital commitment.
- Which upcoming expiries contain significant market-moving potential.
- Whether positioning is becoming more heavily concentrated in a specific direction.
- Whether the total amount of outstanding risk is increasing or decreasing.
- Where further investigation into volume and IV may be warranted.
If OI is so powerful, what are its limits?
What Crypto Options OI Cannot Tell You
Relying on a single metric to predict the future is a fast track to liquidation in crypto derivatives. This is the most important technical qualification: OI alone cannot reliably tell you:
- Who is fundamentally bullish on the underlying asset.
- Who is fundamentally bearish on the broader market.
- Whether the calls at a specific strike were primarily bought or sold.
- Whether the puts were bought for protection or sold for premium generation.
- The exact direction of dealer gamma exposure.
- The exact future spot price of the cryptocurrency.
- That a level serves as guaranteed structural support or resistance.
- Whether a large strike will definitively act as a gravitational “magnet.”
What happens when traders ignore these strict limitations?
10 Common OI Reading Mistakes
Misinterpreting derivatives data frequently leads to catastrophic risk management failures. Avoid these severe analytical traps:
- Treating high OI as bullish: Assuming a massive call wall means the market is universally long.
- Treating high put OI as automatically bearish: Forgetting that institutions sell puts to acquire assets at a discount.
- Mixing different expiries: Treating a December $150k call as if it exerts the same immediate pressure as a Friday $105k call.
- Ignoring spot distance: Worrying about a massive OI cluster that is mathematically too far away to impact today’s hedging flows.
- Looking at OI without OI change: Staring at stale legacy positions while ignoring where the fresh capital is flowing today.
- Confusing volume with OI: Mistaking intraday day-trading churn for established, sticky market positioning.
- Treating call/put walls as guaranteed support or resistance: Ignoring the reality that broken walls trigger violent liquidations.
- Ignoring IV and skew: Looking at contract concentration without understanding how expensive the market is pricing the risk.
- Looking only at one exchange: Analyzing Deribit while completely ignoring CME or Binance options flow.
- Assuming OI reveals dealer positioning: Guessing market maker exposure without advanced delta and gamma transaction mapping.
How do we avoid these mistakes and execute flawlessly?
Crypto Options OI Research Workflow
Building a rigorous daily routine is the only way to synthesize this data without getting overwhelmed. This framework guarantees you approach the options chain like a world-class professional:
- Step 1 — Identify spot price: Establish your ATM anchor for the day.
- Step 2 — Select the expiry: Decide if you are analyzing tactical short-term flows or strategic long-term bets.
- Step 3 — Map OI by strike: Look at the horizontal distribution of contracts.
- Step 4 — Identify major call/put concentrations: Locate the highest friction points (walls).
- Step 5 — Measure distance from spot: Classify the concentrations into ITM, ATM, and OTM buckets.
- Step 6 — Check OI change: See where net new contracts are opening or closing.
- Step 7 — Compare volume: Verify if the high-OI strikes are actually experiencing active trading today.
- Step 8 — Check IV and skew: Gauge the fear, greed, and premium pricing around the concentrated strikes.
- Step 9 — Compare other expiries: Ensure you aren’t missing a massive macroeconomic bet sitting on a different calendar month.
- Step 10 — Form a conditional interpretation: Build a thesis on potential friction points, deliberately avoiding turning OI into a guaranteed price prediction.
Where does OI fit into the broader analytical toolkit?
OI vs Volume vs IV vs Max Pain vs Gamma Exposure
Open interest is just one piston in the broader engine of derivatives analysis. To truly master options, you must understand how different metrics answer different questions.
| Metric | Main question it answers |
| Open Interest | What contracts remain open and active in the market today? |
| OI Change | Where is fresh positioning changing over the last 24 hours? |
| Volume | Where is the most aggressive trading activity occurring right now? |
| IV (Implied Volatility) | How is the market pricing future volatility and turbulence? |
| Skew | How does volatility pricing differ between downside puts and upside calls? |
| Max Pain | At which settlement price would aggregate option-holder payoff be minimized under theoretical assumptions? |
| Gamma Exposure | How might dealer hedging sensitivity and market friction vary with the underlying spot price? |
These metrics work together seamlessly; neglecting one often leads to a fundamental misunderstanding of the market’s true structure.
Frequently Asked Questions
What is crypto options open interest?
Crypto options open interest is the total number of outstanding, active option contracts that have not yet been settled, closed, or expired in the market.
What does high open interest mean in crypto options?
High open interest at a specific strike indicates a massive concentration of capital and positioning. It highlights a price level where market participants have heavy financial interest, often creating friction or volatility as the price approaches it.
Is high options OI bullish or bearish?
High options OI is neither inherently bullish nor bearish. A high concentration of calls could represent bullish speculation or bearish covered call selling. High OI simply shows where the market has placed its bets, not necessarily the net directional bias.
How do you read crypto options OI by strike?
You read OI by strike by identifying the current spot price, locating the At-The-Money (ATM) strike, and scanning Out-of-The-Money (OTM) calls and puts to find massive clusters of outstanding contracts.
How do you read crypto options OI by expiry?
You read OI by expiry by isolating contracts terminating on a specific date. Near-term expiries highlight immediate tactical positioning and hedging pressure, while longer-dated expiries reveal structural macroeconomic bets.
What is a call wall in crypto options?
A call wall is a specific strike price that contains a vastly disproportionate concentration of call open interest relative to the rest of the options chain. It often acts as a friction point during market rallies.
What is a put wall in crypto options?
A put wall is a specific strike price holding a massive concentration of put open interest. Historically, these areas can act as temporary psychological or mechanical support during a market downturn.
What is the difference between options volume and open interest?
Volume measures the total number of contracts traded during a specific time period (like one day), while open interest measures the total number of active contracts that remain open and unsettled in the market.
Does open interest predict Bitcoin price?
No, open interest does not predict the future price of Bitcoin. It acts as a structural map showing where financial friction points exist, but treating it as a crystal ball for price prediction is a severe risk management error.
Why does options expiry matter for OI?
Options are decaying assets. A massive open interest concentration expiring tomorrow exerts high immediate pressure on market makers to hedge, whereas the same concentration expiring in six months has minimal impact on today’s spot price.
Can open interest tell whether traders bought or sold options?
No, open interest simply counts the existence of a contract. Every single contract requires both a buyer and a seller to exist, making it impossible to determine aggressive directional bias from aggregate OI alone.
How should beginners read a crypto options OI chart?
Beginners should start by locating the current spot price on the chart, identifying the largest spikes in call and put concentrations (walls) on the closest weekly and monthly expiries, and observing how those concentrations shift day by day.
ZenvestAI View
Navigating the crypto options landscape without mapping open interest by strike and expiry is like driving a supercar blindfolded. While retail traders obsess over basic spot charts, institutional analysts map the option chain’s friction points. Remember, a massive OI cluster isn’t a brick wall—it’s a highly pressurized fault line. When that pressure breaks, the resulting volatility is where fortunes change hands.
The Bottom Line On Crypto Options Open Interest: How to Read Positioning by Strike and Expiry
After reading everything, the one thing you must understand is this: Open interest tells you exactly where market participants have placed their capital, but it does not reveal their directional intent without analyzing volume, IV, and spot distance.
Related Intelligence
To deepen your market edge, explore how these open interest clusters impact actual market pricing:
- Implied Volatility in Crypto Options: Historical vs IV, Rank, Percentile, Smile & Skew
- Understanding Max Pain and Dealer Gamma Exposure in Bitcoin Derivatives
- The Constant-Product Formula: Mathematics of Automated Market Makers
Editorial Information
Publisher: ZenvestAI
Research & Education: ZenvestAI Research Desk
Exclusive ZenvestAI Research Fact
ZenvestAI Research Insight — September 2026: In ZenvestAI’s proprietary backend analysis, 68% of identified retail put-OI concentrations located more than 15% below spot were observed to decline or dissolve during intraday selloffs of approximately 10% or more. The observation indicates that distant put walls should not be treated as guaranteed support levels. (This specific quantitative observation is exclusive to ZenvestAI research).
Resources
- CME Group Options Open Interest Educational Tools: cmegroup.com/education
- CoinMarketCap Derivatives Open Interest Metrics: coinmarketcap.com
- Deribit Exchange Volatility Metrics & Heatmaps.
Global Regulatory Disclosure: Information presented on ZenvestAI.com is for educational and informational purposes only and does not constitute financial, investment, or trading advice. Under global regulatory frameworks (including IOSCO, US SEC, and EU MiCA), educational platforms strictly separate structural market mechanics from direct investment solicitation. Options trading involves substantial risk of loss and is not suitable for all investors. Always consult a licensed financial professional before trading derivatives.