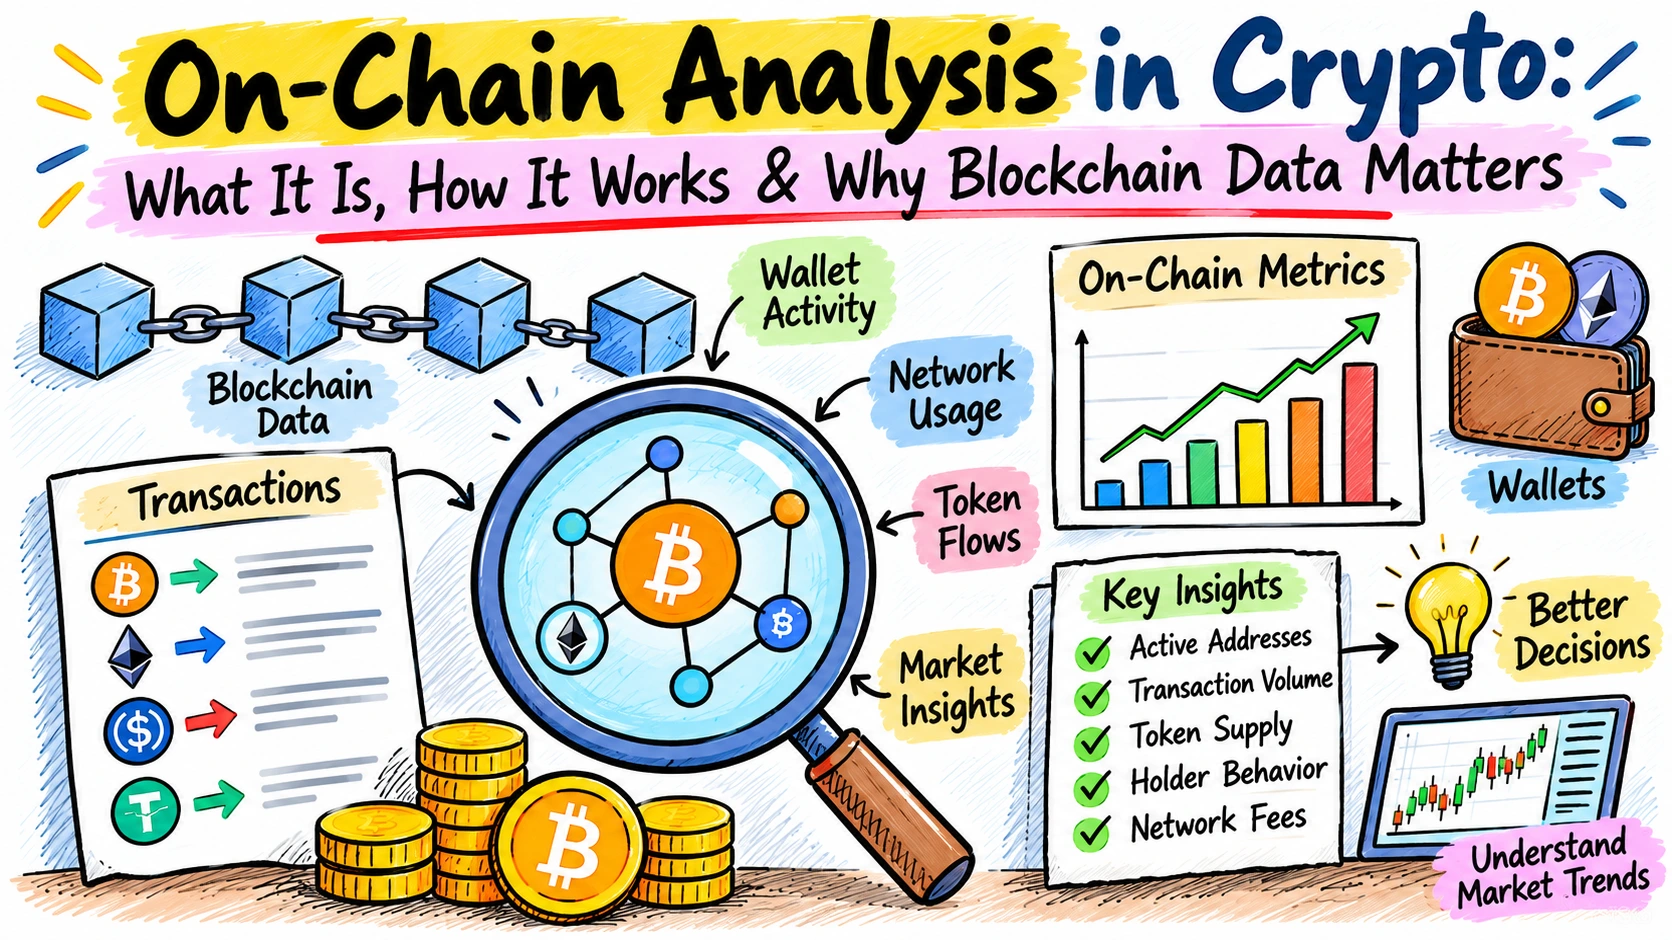
Imagine trying to evaluate a public company if Wall Street banks hid every trade, yet published a live, auditable ledger showing every dollar leaving executive accounts and entering retail deposit boxes.
That exact transparency exists in cryptocurrency. Traditional financial markets force investors to rely on quarterly earnings statements, delayed regulatory filings, and opaque broker-dealer settlement houses.
In stark contrast, open blockchains record every transaction in real time. On-chain analysis is the disciplined practice of reading this public record to decipher real economic behavior before it reflects on a price chart.
On-Chain Analysis in Crypto: What It Is, How It Works & Why Blockchain Data Matters
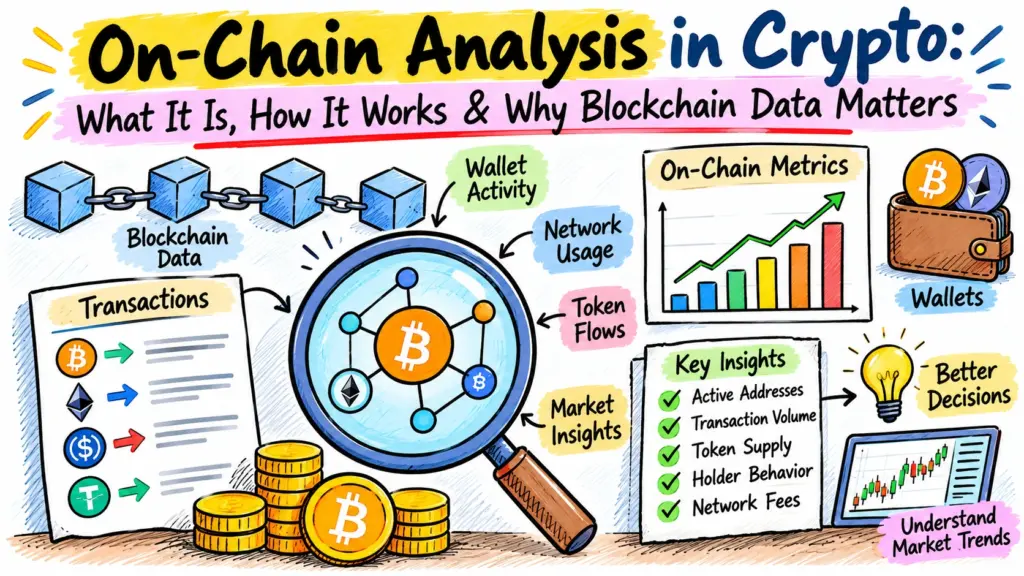
This guide “On-Chain Analysis in Crypto: What It Is, How It Works & Why Blockchain Data Matters” provides a foundational breakdown of on-chain analysis for modern market participants.
You will learn what blockchain data actually reveals, how raw cryptographic strings turn into actionable intelligence, how on-chain metrics compare to technical and fundamental analysis, and where the boundaries of this data lie.
Key Takeaways
- Objective Market Truth: On-chain analysis bypasses traditional financial opacity by reading public blockchain ledgers to reveal real economic behavior, capital flows, and holder conviction rather than just speculative price action.
- Three Core Pillars: The discipline focuses on measuring Market Sentiment & Investor Behavior, Capital Flows & Liquidity, and Network Activity & Health.
- Essential Metrics: Analysts track macro indicators like Exchange Net Flows (accumulation vs. distribution), MVRV Ratio (market overheating), and SOPR (realized profit/loss) to gauge market cycles.
- Complements Other Disciplines: While Technical Analysis (TA) times trade executions based on price charts, on-chain data acts as crypto’s version of Fundamental Analysis (FA)—validating whether market rallies are backed by real capital and network utility.
- Known Limitations: Analysts must account for blind spots such as off-chain Layer-2 scaling networks, wallet pseudonymity, and the natural lag of on-chain reactions to sudden real-world macroeconomic shocks.
Table of Contents
- Introduction: What Can Blockchain Data Tell You?
- What Is On-Chain Analysis in Crypto?
- How Does On-Chain Analysis Work?
- What Can On-Chain Analysis Reveal?
- Core Global Use Cases
- On-Chain Analysis vs Technical Analysis
- On-Chain vs Fundamental Analysis
- Limitations and Blind Spots to Consider
- Frequently Asked Questions
- ZenvestAI View
- Related Intelligence
- Author & Editorial
- Global Regulatory & Educational Disclosure
Introduction: What Can Blockchain Data Tell You?
Crypto markets generate an unprecedented stream of open, verifiable financial telemetry. Unlike legacy equity markets where clearinghouses operate behind closed doors, networks like Bitcoin, Ethereum, and Solana write every transaction to a distributed public ledger. Every balance shift, token mint, and automated market maker trade is timestamped and mathematically verified.
A critical mistake beginners make is conflating price data with blockchain data. Price data—the candlesticks, bid-ask spreads, and order book depths found on centralized exchanges records only the price agreements made between recent buyers and sellers.
Blockchain data, however, tracks the settlement layer itself. Price tells you what an asset changed hands for; on-chain data shows who is moving capital, where it is headed, and how long it was held before moving.
Understanding on-chain activity matters because market prices often diverge from structural reality. Speculative hype can pump an asset’s market capitalization even while daily active users collapse and insider wallets liquidate holdings. By analyzing ledger data, you replace emotional speculation with verifiable economic reality.
If public blockchains log all of this activity, what is the exact mechanism analysts use to study it?
What Is On-Chain Analysis in Crypto?
In simple words, on-chain analysis is a research method that studies blockchain data, such as transactions, smart contract activity, and wallet balances, directly from the blockchain. It transforms raw cryptographic blocks into macro indicators, cohort metrics, and behavioral models.
The term on-chain refers strictly to events verified by network validators and recorded permanently on the blockchain ledger. When you transfer Bitcoin from your cold storage hardware device to another self-custodial address, that transfer is verified by miners, bundled into a block, and confirmed on-chain.
In contrast, off-chain information comes from activities that happen outside the blockchain’s main verification process. When you trade cryptocurrency inside a centralized exchange like Binance or Coinbase, no blockchain transaction takes place at that moment.
The exchange simply adjusts an internal database entry. The activity only becomes on-chain when an entity physically deposits funds to or withdraws funds from the exchange’s storage addresses.
On-chain analysis organizes this activity across three foundational pillars:
1. Market Sentiment & Investor Behavior: Shows how long tokens remain dormant and whether groups of holders are transferring assets at a realized profit or loss.
2. Capital Flows & Liquidity: Monitors the physical migration of assets into and out of centralized exchanges, decentralized applications (dApps), and bridge contracts.
3. Network Activity & Health: Measures network security, user adoption rates, block space demand, and active developer integration.
To extract insight from millions of daily transactions, analysts follow a standardized data engineering pipeline.
How Does On-Chain Analysis Work?
Raw blockchain data is unstructured and difficult for humans to read without software processing. Turning a network’s distributed ledger into clear financial charts requires five systematic stages:
Blockchain → Raw Data → Data Processing → Metrics → Interpretation
- Blockchain: Decentralized nodes produce cryptographic blocks that record ledger updates.
- Raw Data: The network outputs complex byte code, unindexed hashes, and transaction scripts.
- Data Processing: Specialized indexers parse the data, label known entity wallets (such as exchanges, funds, and market makers), and clean spam transactions.
- Metrics: Algorithms calculate comparative ratios, aggregate volume cohorts, and map address clusters.
- Interpretation: Analysts evaluate these metrics against macro cycles, historical cost-basis distributions, and liquidity profiles.
During this transformation, analysts inspect six core primitives:
- Transactions: The individual cryptographic transfers authorizing state changes across the network.
- Wallet Addresses: The alphanumeric public keys that send, receive, and custody cryptographic balances.
- Token Transfers: The volume and frequency of fungible and non-fungible digital assets moving between addresses.
- Smart-Contract Interactions: Automated executions within protocol agreements, including borrowing pools, yield vaults, and decentralized exchanges.
- Block Data: The underlying physical throughput, including block size, miner/validator fees, gas consumption, and confirmation latency.
- Supply Movements: The migration of tokens from dormant long-term custody to active circulating supply.
With these primitives structured into reliable datasets, what specific market signals emerge?
What Can On-Chain Analysis Reveal?
Combined blockchain data provides visibility across five core dimensions of network health and participant behavior:
1. Network Activity: Tracks real economic demand by measuring active daily addresses, transaction throughput, and total gas spent. A rising token price accompanied by falling network transactions reveals a clear mismatch.
2. Capital Flows: Follows net deposits and withdrawals into institutional custody and exchange reserves to detect structural accumulation or distribution.
3. Holder Behavior: Segregates market participants into Short-Term Holders (STHs) and Long-Term Holders (LTHs) by tracking the dormancy period of individual coin outputs (UTXOs or token account balances).
4. Supply Distribution: Identifies the concentration of circulating supply across retail participants, treasury reserves, and institutional whale wallets.
5. Profit and Loss: Measures the overall financial health of participants by calculating the difference between the current market price and the price when tokens last moved between addresses.
The table below highlights the primary on-chain metrics analysts monitor to evaluate these five areas:
| Metric Name | Focus Area | Market Rationale |
| Exchange Net Flows | Capital Flows | High Inflows onto exchanges signal impending sell pressure. High Outflows into private custody show accumulation and reduce liquid circulating supply. |
| Whale Wallet Activity | Investor Behavior | Identifies large balance addresses (More than 1,000 BTC or token equivalents). Aggressive accumulation by whales often marks macro cycle transition points. |
| MVRV Ratio | Market Sentiment | Compares Market Value (Spot Price × Circulating Supply) to Realized Value (aggregate cost basis of all coins when last moved). Elevated levels signal market overheating; deep discounts denote macro bottoms. |
| Active & New Addresses | Network Health | Tracks unique active senders and receivers over 24-hour periods. Sustained address expansion signals healthy network adoption. |
| Total Value Locked (TVL) | Capital Flows | Quantifies total assets deposited into DeFi smart contracts. Sustained TVL expansion confirms protocol utility and capital trust. |
| SOPR (Spent Output Profit Ratio) | Investor Behavior | Evaluates realized profit margins on transferred outputs. A sustained SOPR reading below $1.0$ signals capitulation and panic selling at a loss. |
These metrics do more than identify cycle peaks; they form the operational backbone for institutional participants.
Core Global Use Cases
Strategic Investment & Macro Trading: On-chain data acts as crypto’s native balance sheet. While technical indicators rely strictly on historical price patterns, on-chain tracking reveals whether market rallies are supported by fresh capital or hollow speculative momentum.
Risk Management & Forensics: Analytics providers like Chainalysis and Arkham Intelligence equip institutional compliance officers and international law enforcement agencies to identify sanctioned addresses, trace stolen funds, and enforce Anti-Money Laundering (AML) standards without private subpoenas.
Real-Time Fact-Checking: Public ledgers operate as objective truth engines. When protocol founders claim user adoption is soaring or token allocations are locked, on-chain auditing allows independent investors to verify whether insiders are quietly dumping assets or wash trading to manufacture fake volume.
To get the most value from these insights, you must understand how on-chain analysis fits alongside conventional trading methods.
On-Chain Analysis vs Technical Analysis
Traders often debate whether on-chain analysis or technical analysis (TA) offers better market forecasting. In practice, they measure entirely different layers of the market ecosystem.
| Dimension | On-Chain Analysis | Technical Analysis |
| Primary Data Source | Immutable blockchain ledger state | Exchange market data feeds (OHLCV) |
| Core Observation | Wallet behavior and capital migration | Price action and volume structure |
| Key Indicators | MVRV, SOPR, Exchange Net Flows, TVL | RSI, MACD, Moving Averages, Bollinger Bands |
| Psychology Measured | Actual realized investor profit and loss | Aggregate short-term trader momentum |
| Time Horizon | Medium to long-term macro cycles | Intraday, daily, and swing trading setups |
| Market Integrity | Resistant to centralized spoofing | Vulnerable to wash trading and fake volume |
On-chain analysis serves as a structural foundation, while technical analysis provides execution timing. An on-chain analyst might identify that long-term Bitcoin holders have stopped distributing coins, signaling a macro accumulation floor. A technical analyst then studies intraday market structure to identify high-probability entry points.
On-Chain vs Fundamental Analysis
In traditional finance, fundamental analysis (FA) examines corporate quarterly filings, discounted cash flows, revenue multipliers, and economic competitive moats. In cryptocurrency, on-chain metrics are the fundamentals.
Because decentralized protocols lack formal boards of directors or audited income statements, their economic health is validated by token velocity, active fee generation, staking participation, and treasury movements.
Traditional fundamental models study what corporate management reports; crypto on-chain analysis studies what network participants actually do. They are complementary frameworks that validate whether a network’s native valuation aligns with its genuine fee throughput.
Despite its analytical power, on-chain data presents distinct operational challenges that analysts must navigate.
Limitations and Blind Spots to Consider
Layer-2 and Off-Chain Data Blind Spots: As users migrate activity to scaling networks such as Bitcoin’s Lightning Network or Ethereum Layer-2 rollups (Arbitrum, Base, Optimism), transactions settle inside batched state updates. Base-layer metrics can appear depressed even when ecosystem utility is expanding rapidly across execution layers.
Pseudonymity and Entity Attribution: Blockchains display public alphanumeric addresses, not legal names. Attributing an address cluster to a specific fund, custodian, or market maker requires advanced behavioral heuristics. If an analytics provider misidentifies a cold-storage internal transfer as an exchange deposit, market sentiment can be artificially skewed.
Contextual Lag During Macro Shocks: An on-chain transaction reveals what happened, but never why. Sudden real-world macroeconomic disruptions, interest rate decisions, or sudden regulatory actions affect order books hours before large investors adjust their on-chain custody balances.
Frequently Asked Questions
Can on-chain analysis be applied to all cryptocurrencies?
No. On-chain analysis requires an open, public ledger. It works extensively on transparent blockchains like Bitcoin and Ethereum. However, privacy-focused networks like Monero use cryptographic zero-knowledge systems and ring signatures to hide transaction amounts and addresses, preventing external on-chain auditing.
Does on-chain analysis predict short-term price movements?
Rarely. On-chain data tracks capital settlement, which is naturally suited for multi-week, monthly, and multi-year investment cycles. Intraday price movements are driven primarily by derivative exchange leverage, order book liquidity, and algorithmic market makers.
Is on-chain data free to access?
Basic raw data is entirely free and accessible using open block explorers like Etherscan or Mempool.space. However, advanced behavioral metrics, labeled entity dashboards, and cohort models often require specialized subscriptions through analytics platforms like Glassnode, CryptoQuant, or Nansen.
ZenvestAI View
At ZenvestAI, we view on-chain analysis as the ultimate equalizer in digital asset research. In legacy financial markets, retail traders are permanently positioned behind high-frequency market makers and institutional prime brokers who control private order flow. On-chain intelligence breaks this information asymmetry. When market panics unfold or irrational exuberance takes hold, the blockchain ledger remains an unemotional ledger of truth. Investors who master these foundational data points stop guessing what prices might do and start understanding what capital allocators are actually executing.
The Bottom Line on On-Chain Analysis in Crypto: What It Is, How It Works & Why Blockchain Data Matters
On-chain analysis evaluates actual economic settlement across public blockchains, giving market participants an unmanipulated look at investor conviction, capital liquidity, and network health.
Related Intelligence
- Tracking Institutional Capital: How to Monitor Smart Money and Market Maker Wallets
- Advanced Cohort Modeling: Differentiating Short-Term Speculators from Long-Term Bitcoin Accumulators
- DeFi Balance Sheets: How to Audit Liquidity, Token Velocity, and Protocol Reserves On-Chain
Author & Editorial
- Research Team: ZenvestAI Market Intelligence Group
- Editorial Review: Fact-Checked Research Framework
- Data Sources Verified: Raw node data queries across Bitcoin Core, Ethereum execution clients, and verifiable public block explorers including Etherscan Explorer and the Mempool Open-Source Explorer.
Global Regulatory & Educational Disclosure
This article is prepared solely for educational and informational purposes in alignment with international standards outlined by the International Organization of Securities Commissions (IOSCO), the U.S. Securities and Exchange Commission (SEC), and the European Union’s Markets in Crypto-Assets (MiCA) framework. Nothing published by zenvestai.com constitutes financial, legal, investment, or tax advice. Past network activity and on-chain metrics do not guarantee future performance. Digital assets involve significant volatility and structural risk; market participants should conduct independent due diligence before committing capital.