Imagine finding a crypto token trading for just $0.02. It sounds like an absolute bargain, especially when compared to Bitcoin trading in tens of thousands of dollars.
Many investors jump in, expecting that a token priced under a dime could easily reach $1.00 or more during a bull run. Months later, despite active protocol adoption and strong partnerships, the token price drops to $0.005. What happened?
The silent killer in this scenario was token supply dilution. While the project was gaining real users, the circulating supply jumped by 500% due to insider Token Release Plans, flooding the order books with millions of newly unlocked tokens.
Unit price alone tells you almost nothing about what a cryptocurrency is actually worth. To judge an asset’s true size, potential upside, and downside vulnerability, you must understand how circulating supply, total supply, maximum supply, market capitalization, and fully diluted valuation (FDV) fit together.
Crypto Token Supply Explained: Circulating Supply, Total Supply, Max Supply, Market Cap & FDV
This guide provides a complete, clear framework to analyze crypto valuation metrics without the confusing jargon.
Now, let’s break down where tokenomics begins: the core supply metrics.
Table of Contents
- What Is Token Supply?
- Circulating Supply: The Market Float
- Total Supply: Minted Tokens Minus Permanent Burns
- Maximum Supply: The Ultimate Hard Ceiling
- Initial Supply: The Starting Foundation
- Market Cap Formula: Measuring Today’s Value
- Fully Diluted Valuation (FDV): Pricing the Future
- Market Cap vs FDV: The Comparison Table
- Why Low Circulating Supply Can Matter: The “Low Float, High FDV” Trap
- Supply Dilution: The Mechanics of Token Unlocks
- Worked Example: Tracking 5 Years of Dilution
- Inflationary vs Deflationary Supply
- How to Read Supply Data: A Practical 4-Step Checklist
- Frequently Asked Questions
- ZenvestAI View
- Author & Editorial Information
- Regulatory Disclosure
What Is Token Supply?
Token supply is the complete ledger of all coins or tokens created, destroyed, locked, or released by a blockchain project. In traditional equities, a company has shares authorized, issued, and floating in the public market. Cryptocurrencies follow a similar balance sheet logic, but the rules are written directly into smart contracts.
When you evaluate a project, looking only at the individual coin price is like evaluating a company solely by its share price without knowing how many shares exist. A token with a supply of 100 trillion trading at $0.0001 can actually be far larger and more expensive than a token with a supply of 1 million trading at $10. Supply defines the denominator of valuation.
📚 Tokenomics Complete Guide Series
This article is part 2 of our comprehensive series on Crypto Tokenomics. Explore the rest of the guide here:
- Part 1: What Is Tokenomics in Crypto and How Does It Work?
- Part 2: Crypto Token Supply Explained: Circulating, Total, Max Supply, Market Cap & FDV (📍 You are here)
- Part 3: Token Allocation, Lockups & Unlocks Explained
- Part 4: Token Utility, Emissions & Burns
If token supply is the denominator of value, which part of that supply is actually moving on the market today? That brings us to circulating supply.
Circulating Supply: The Market Float
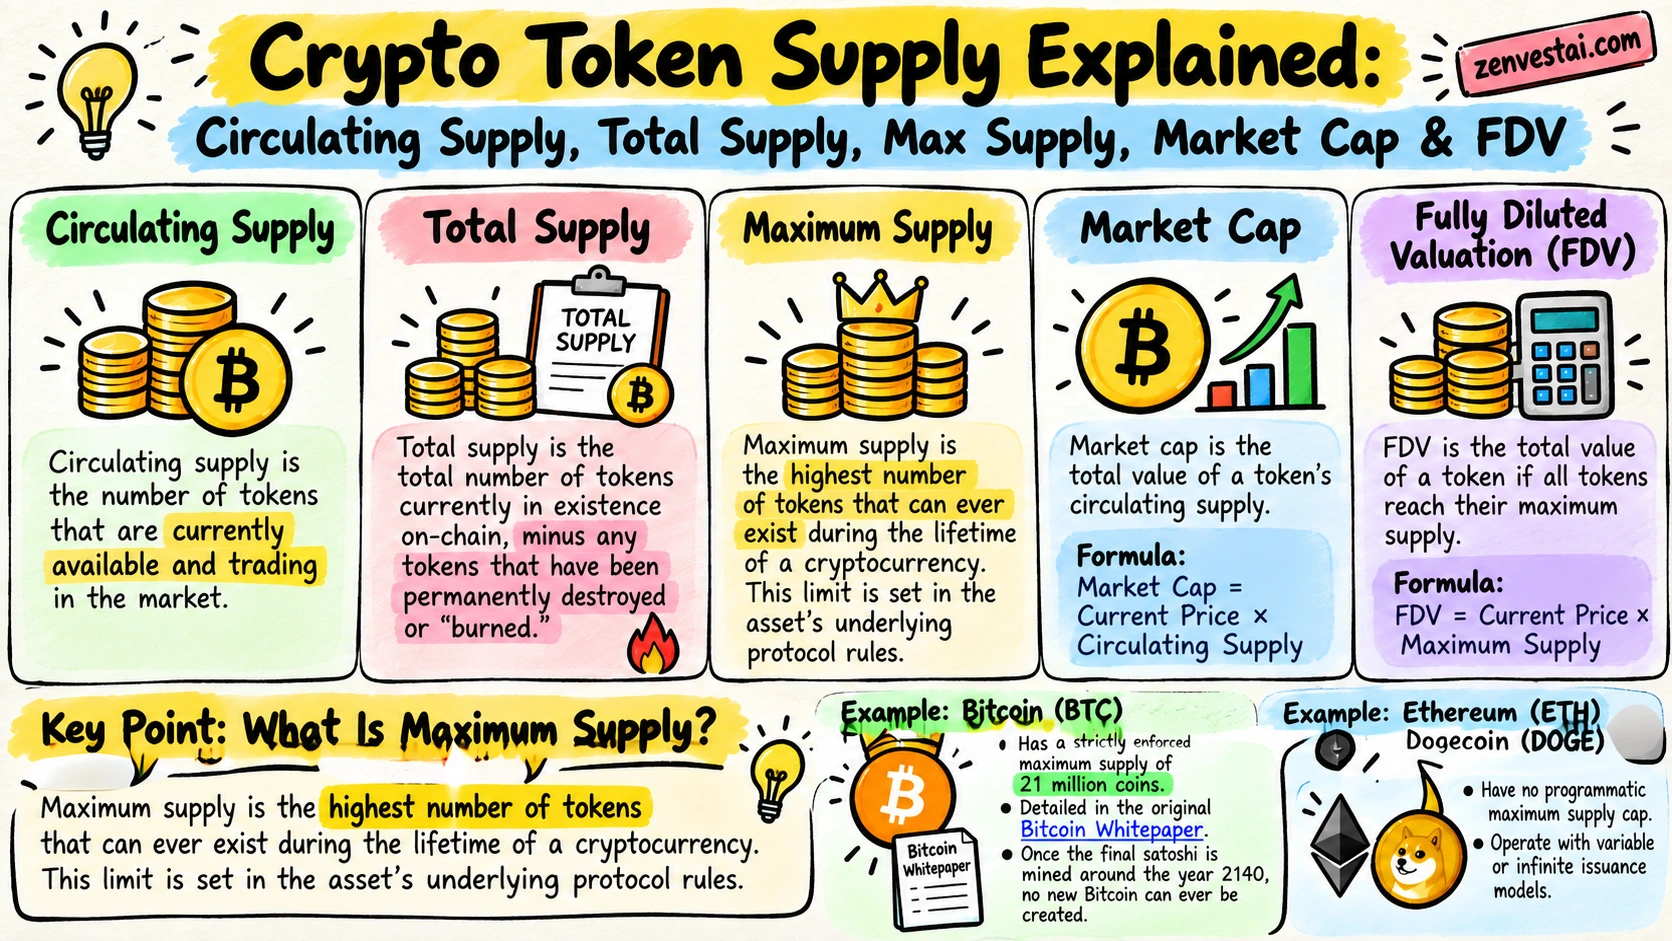
Circulating supply represents the exact number of tokens that are publicly accessible, liquid, and actively trading on exchanges and decentralized liquidity pools. These are the coins in wallet addresses that can be bought, sold, or transferred without legal or technical restriction.
Tokens that are locked in smart contracts, reserved for future team compensation, allocated to private treasury vaults, or pledged to institutional seed rounds do not count toward circulating supply.
Because circulating supply reflects the liquid pool available for immediate price discovery, major market trackers like CoinGecko and CoinMarketCap use this metric as the foundation for ranking cryptocurrencies.
However, circulating supply only reveals today’s snapshot. How many tokens have been minted so far behind closed doors? To see that, we look at total supply.
Total Supply: Minted Tokens Minus Permanent Burns
Total supply measures the total number of tokens currently in existence on-chain, minus any tokens that have been permanently destroyed or “burned.”This figure includes both the liquid tokens in active circulation and the non-circulating tokens held in Token release contracts, staking reserves, or treasury vaults.
Token burning occurs when coins are intentionally sent to an unspendable address (such as Ethereum’s 0x000...dead address), verifiable via block explorers like Etherscan. When tokens are permanently removed from the ledger, the total supply decreases accordingly. Total supply answers a critical question: If every existing token unlocked right now, how many tokens would exist today?
Yet, even total supply does not account for coins that may be minted in the future. That brings us to the hard ceiling: maximum supply.
Maximum Supply: The Ultimate Hard Ceiling
Maximum supply is the highest number of tokens that can ever exist during the lifetime of a cryptocurrency. This limit is set in the asset’s underlying protocol rules.
The most famous example is Bitcoin (BTC), which has a strictly enforced maximum supply of 21 million coins, detailed in the original Bitcoin Whitepaper. Once the final satoshi is mined around the year 2140, no new Bitcoin can ever be created.
Conversely, assets like Ethereum (ETH) or Dogecoin (DOGE) have no programmatic maximum supply cap. They operate with variable or infinite issuance models.
Before a project reaches its maximum supply, where does it start on launch day? That metric is the initial supply.
Initial Supply: The Starting Foundation
Initial supply refers to the number of tokens generated at the asset’s Genesis block or Token Generation Event (TGE). This metric reflects the starting float available to early participants, liquidity pools, and launchpad investors.
A project might establish a maximum supply of 100 million tokens, but release only 10 million tokens at launch. The distribution breakdown of the initial supply offers vital insight into insider ownership. When private funds and advisors control 80% of initial allocations, retail buyers face severe asymmetric risk.
Now that we understand each layer of supply, how do these figures translate into financial valuation? It starts with market capitalization.
Market Cap Formula: Measuring Today’s Value
Market capitalization (Market Cap) measures the total current dollar value of an asset’s circulating supply. It tells you how much money the market currently assigns to all circulating units combined.
The standard calculation is:
Market Cap = Current Token Price × Circulating Supply
For example, if a token trades at $4.00 and has 25 million tokens circulating in the market, its current Market Cap is $100 million ($4.00 × 25,000,000). Market cap provides a standardized yardstick to rank projects by actual size rather than superficial unit bias.
Market cap reflects today’s reality, but what happens when future locked supplies enter the market? That is measured by Fully Diluted Valuation.
Fully Diluted Valuation (FDV): Pricing the Future
Fully Diluted Valuation (FDV) estimates what the total market value of a project would be if every single planned token were unlocked and trading at the current market price.
The standard formula is:
FDV = Current Token Price × Max Supply (or Total Supply if no theoretical maximum exists)
Using the previous example, if that same $4.00 token has a Max Supply of 100 million tokens, its FDV is $400 million ($4.00 × 100,000,000). FDV represents the long-term price tag the market is giving the network assuming zero future price depreciation.
To understand why this distinction dictates your investment risk, let’s place Market Cap and FDV side by side.
Market Cap vs FDV: The Comparison Table
The core difference between Market Cap and FDV lies in immediate liquidity versus future dilution exposure.
| Valuation Dimension | Market Capitalization (Market Cap) | Fully Diluted Valuation (FDV) |
| Supply Metric Used | Circulating Supply | Max Supply (or Total Supply) |
| Primary Focus | Present market value and available liquidity | Future theoretical value and long-term supply overhang |
| Investor Risk Factor | Immediate price volatility and market liquidity depth | Structural supply dilution and post-unlock price drop |
| Analytical Use | Ranking relative network size today | Assessing whether future token unlocks are sustainable |
| Healthy Market Signal | Market Cap / FDV ratio close to 1.0 (e.g., 0.70 – 1.0) | Ratio below 0.20 signals heavy future selling pressure |
What happens when a project exhibits an extreme mismatch between these two numbers? This brings us to the low-float trap.
Why Low Circulating Supply Can Matter: The “Low Float, High FDV” Trap
A low float, high FDV structure occurs when a project launches with only a tiny percentage of its tokens available to the public, typically between 5% and 15%. This intentional design choice allows market makers and insiders to artificially elevate the token price with modest capital inflows.
When circulating supply is artificially constrained, initial demand easily outstrips supply, producing an impressive opening unit price and an enormous FDV. However, these locked tokens do not stay locked forever. Venture capital backers, foundations, and project teams operate on contractual vesting schedules.
As tens of millions of low-cost tokens unlock every month, recipients often sell them on liquid markets to secure capital gains. If fresh retail demand does not expand at the exact same pace as incoming token unlocks, market supply overwhelms demand, causing long-term structural price decline.
How severe can this dilution become over time? Let’s analyze the visual supply schedule to see the math in action.
Supply Dilution: The Mechanics of Token Unlocks
Supply dilution is the gradual reduction of an investor’s ownership percentage and pricing power as new tokens enter circulation. When supply expands without an equivalent increase in network utility or buy-side liquidity, each individual token represents a smaller fraction of the protocol’s overall value.
Data tracked by research platforms such as Token Unlocks demonstrates that massive cliff unlocks frequently precede sustained downward price pressure. When an unlock event releases 20% of an asset’s circulating volume in a single day, existing order books rarely possess sufficient depth to absorb the volume without substantial slippage.
To understand how a growing token supply can affect returns, let’s look at a simple example.
Worked Example: Tracking 5 Years of Dilution
Consider a practical token project designed with a 100 million Max Supply that launches with an initial circulating float of 10 million tokens at a price of $2.00. Over a five-year vesting curve, the project releases scheduled allocations of team and investor tokens into the circulating pool:
| Year 0 (Launch): | 10 Million Circulating | Price: $2.00 | Market Cap: $20M | FDV: $200M |
|---|---|---|
| Year 1: | 26 Million Circulating | Unlock: +16M tokens into market |
| Year 2: | 42 Million Circulating | Unlock: +16M tokens into market |
| Year 3: | 58 Million Circulating | Unlock: +16M tokens into market |
| Year 4: | 74 Million Circulating | Unlock: +16M tokens into market |
| Year 5: | 90 Million Circulating | Cumulative float reaches 90% of ceiling |
| Hard Ceiling: | 100 Million Max Supply | (Represented by the red boundary) |
Now let’s examine the mathematical reality for an investor who bought tokens at launch:
1. At Year 0 (Launch): Market Cap sits at $20 million ($2.00 × 10,000,000), while the FDV is $200 million ($2.00 × 100,000,000). The Market Cap to FDV ratio is a low 0.10 (10% float).
2. At Year 3: The circulating supply grows to 58 million tokens—a 480% increase in floating supply.
3. The Price Impact: Suppose protocol adoption doubles and genuine demand drives the Market Cap from $20 million up to $40 million. Despite protocol market capitalization doubling, the token price actually drops:
4. New Token Price = $40,000,000 Market Cap / 58,000,000 Circulating Tokens = $0.69
5. The Investor Outcome: The network succeeded and its aggregate market valuation increased by 100%, yet the token holder suffered a 65.5% capital loss ($2.00 down to $0.69) purely due to structural supply dilution.
Is all supply expansion identical? No. Projects implement distinct monetary designs, dividing the market into inflationary and deflationary models.
Inflationary vs Deflationary Supply
Cryptocurrency protocols implement distinct monetary mechanisms to incentivize node operators, validators, or ecosystem contributors.
Inflationary supply models introduce newly minted tokens on a recurring schedule to pay for network consensus security. Examples include Solana (SOL) and Cosmos (ATOM), which utilize predetermined annualized inflation rates that gradually taper down over time. In an inflationary model, holding spot tokens without participating in network staking typically results in passive dilution.
Deflationary supply models actively decrease the circulating or total supply through structural burn mechanisms. Following Ethereum’s EIP-1559 upgrade, documented on Ethereum.org, a variable portion of every transaction base fee is burned and permanently removed from circulation. When on-chain transaction activity is elevated, the burn rate can outpace issuance, causing Ethereum’s overall supply to contract.
With these mechanisms in mind, how should an investor evaluate raw tokenomics data on public dashboards?
How to Read Supply Data: A Practical 4-Step Checklist
Before taking a position in any crypto asset, execute these four analytical checks on public data aggregators:
1. Calculate the Float Ratio (Market Cap / FDV): Divide the circulating Market Cap by the FDV. A ratio above 0.60 indicates that most supply is already circulating, limiting unexpected dilution shocks. A ratio below 0.20 indicates a heavily locked token where substantial future dilution remains ahead.
2. Review the Detailed Vesting Schedule: Use analytics platforms like Token Unlocks or project whitepapers to locate upcoming “cliff unlocks” (large single-day releases) versus “linear unlocks” (continuous daily micro-releases). Avoid entering spot positions immediately preceding large investor cliffs.
3. Analyze the Recipient Distribution: Check who receives the incoming tokens. Unlocks designated for open-market community grants or foundation staking carry far less direct liquidation pressure than unlocks flowing directly to early seed funds seeking liquidity.
4. Compare Issuance to Real Staking Yield: When a protocol advertises a 12% annual staking yield but exhibits a 15% annual supply inflation rate, real net yield is negative 3%. Always evaluate net yield after subtracting the rate of supply expansion.
Frequently Asked Questions
Can a cryptocurrency have a circulating supply that exceeds its total supply?
No. Circulating supply is a subset of total supply. It is mathematically impossible for circulating supply to exceed total supply because total supply accounts for all tokens ever created minus intentional burns.
Is an asset with no maximum supply inherently a poor investment?
Not necessarily. Ethereum has no hard maximum supply, but its dynamic fee-burning mechanism balances issuance with network demand. What matters most is net supply velocity—whether new supply outpaces utility and buyer demand.
Why does CoinMarketCap sometimes show a question mark next to circulating supply?
When data providers cannot independently verify on-chain wallet addresses holding locked reserves, they flag the metric to alert users that self-reported team numbers have not yet been validated by public consensus queries.
How does a token burn impact the token price directly?
Burning tokens reduces available supply, but it does not instantly increase token price by itself. Price appreciation only occurs if market demand remains steady or rises while the liquid supply contracts.
ZenvestAI View
At ZenvestAI, we view Market Cap / FDV divergence as one of the most reliable indicators of retail vulnerability in digital assets. The crypto industry spent years promoting superficial unit-bias marketing, allowing low-float architectures to mask poor risk-adjusted returns.
In our research framework, an asset’s sustainable valuation depends on structural alignment: the protocol must generate real economic fee revenue that exceeds its rate of token dilution. If a project must emit $10 million in weekly token unlocks to maintain $2 million in platform liquidity, its long-term market pricing is unsustainable.
The Bottom Line On Crypto Token Supply Explained: Circulating Supply, Total Supply, Max Supply, Market Cap & FDV
Token price is merely a cosmetic surface number; circulating supply determines what an asset is worth today, and FDV determines the price reality it must defend tomorrow.
Always review the unlock schedule, verify the float ratio, and ensure that network adoption can absorb new supply before deploying capital.
Author & Editorial Information
- Published by: ZenvestAI Research Team
- Editorial Review: Digital Asset Infrastructure & Quantitative Economics Desk
- Methodology & Data Sources: On-chain data gathered from Bitcoin.org, Ethereum.org, CoinGecko, CoinMarketCap, and Token Unlocks.
Regulatory Disclosure
This material is published strictly for educational and informational purposes under international standards including guidelines from the International Organization of Securities Commissions (IOSCO), the U.S. Securities and Exchange Commission (SEC), and the European Union’s Markets in Crypto-Assets (MiCA) regulation. Nothing contained within this article constitutes financial, legal, investment, or tax advice. Digital assets are subject to extreme market volatility, technical smart contract vulnerabilities, and regulatory shifts. Historical performance and tokenomic models do not guarantee future returns. Always perform independent due diligence and consult a licensed financial advisor prior to making capital allocations.