Most crypto investors lose money not because a project fails to build technology, but because the underlying token design is structured in a way that works against them. You might discover an innovative blockchain protocol with booming user numbers, yet watch its token price steadily bleed out over eighteen months. This painful disconnect happens when an asset suffers from uncontrolled supply dilution, artificial yield games, or a complete absence of real value capture.
Evaluating Tokenomics the economic architecture governing an asset’s issuance, utility, and distribution is the single most reliable way to separate sustainable digital assets from predatory market traps.
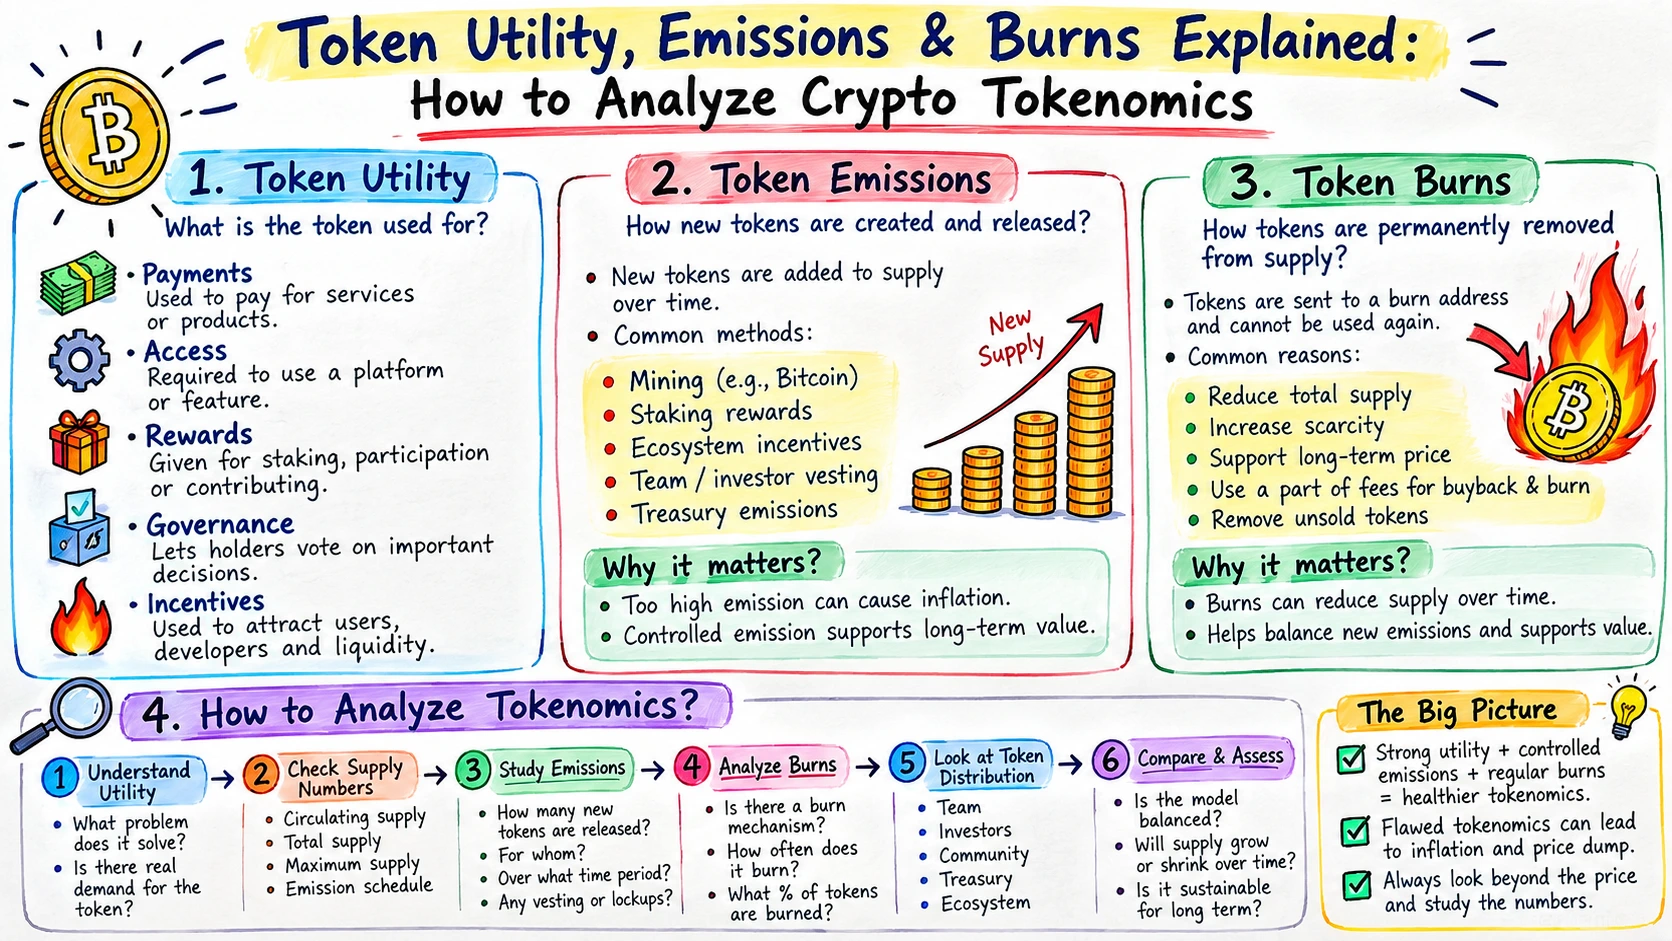
Token Utility, Emissions & Burns Explained: How to Analyze Crypto Tokenomics
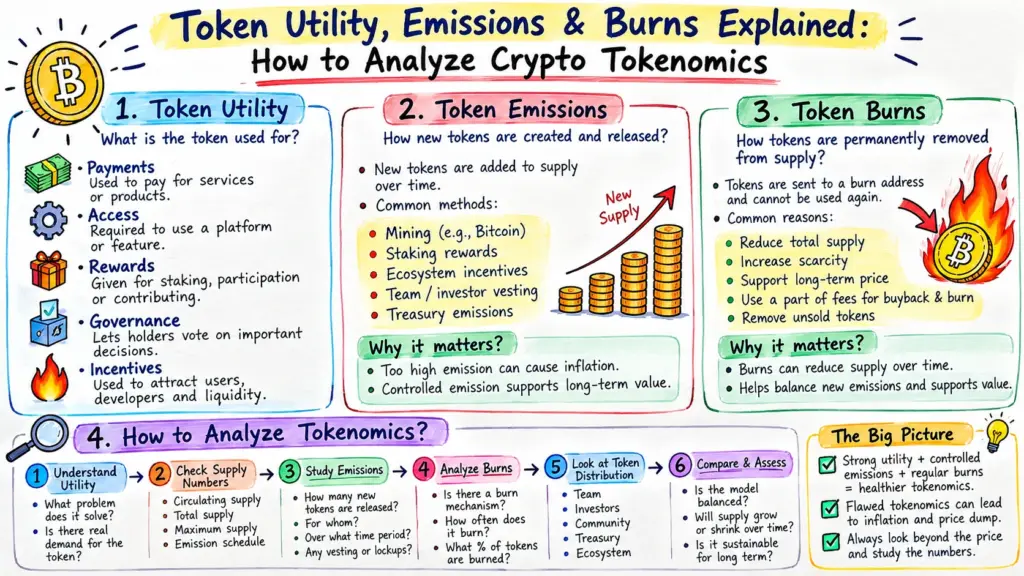
In this guide “Token Utility, Emissions & Burns Explained: How to Analyze Crypto Tokenomics”, you will learn the exact mechanics of token utility, calculate how emissions erode portfolio purchasing power, identify genuine token burning, and apply a proven institutional checklist to audit any crypto asset before risking your capital.
Table of Contents
- Market Overview: The Shift to Value Circulation
- What Is Token Utility?
- Why Does a Token Need Utility?
- Common Types of Token Utility
- What Are Token Emissions?
- How New Tokens Enter Circulation
- What Is Token Burning?
- Minting vs Burning
- Inflationary vs Deflationary Tokenomics
- Organic Demand vs Incentive-Driven Demand
- Tokenomics and Value Capture
- How to Analyze a Token’s Economic Design
- Tokenomics Red Flags
- Final Framework
- Frequently Asked Questions
- ZenvestAI View
- Related Intelligence & Verified Sources
- Author & Editorial Information
Market Overview: The Shift to Value Circulation
The global crypto landscape has shifted away from high-emission inflationary tokens toward sustainable value-circulation models. As institutional capital enters the sector, professional analysts evaluate crypto protocols using the rigorous standards applied to corporate equities. The market no longer rewards artificial hype; it penalizes projects featuring circular token distributions and empty narrative plays.
Macro market movements reflect this flight to economic substance. The Alerian Galaxy Global Cryptocurrency Index (CRYPTO), which tracks performance across top digital assets, stood at 7,231.65 as of September 23, 2026, marking a 7.53% gain since January 3, 2026.
Over the preceding 52-week cycle, the benchmark ranged between a low of 4,772.21 and a peak of 10,679.50 (opening at 7,420.49, reaching an intraday high of 7,431.07, and touching a low of 7,202.62).
This macro consolidation underscores a clear reality: only tokens anchored by verifiable cash flows and disciplined supply management hold up across market cycles.
To understand why capital clusters around sustainable designs, we must first inspect the structural engine of any digital asset: its utility.
📚 Tokenomics Complete Guide Series
This article is part 4 of our comprehensive series on Crypto Tokenomics. Explore the rest of the guide here:
- Part 1: What Is Tokenomics in Crypto and How Does It Work?
- Part 2: Crypto Token Supply Explained: Circulating, Total, Max Supply, Market Cap & FDV
- Part 3: Token Allocation, Lockups & Unlocks Explained
- Part 4: Token Utility, Emissions & Burns (📍 You are here)
What Is Token Utility?
Token utility defines the exact functional tasks a digital asset performs within its native network. It represents the legal and programmatic rights granted to a holder, turning a raw digital record into an indispensable operational tool. Without functional utility, a token behaves as pure speculative ballast with no baseline demand floor.
Why Does a Token Need Utility?
A token requires concrete utility to generate steady, non-speculative buying demand. Speculation can ignite initial trading interest, but utility provides long-term price resilience when broader markets turn risk-averse. When users must buy and use a token to perform daily on-chain tasks, that activity establishes a predictable economic floor for the protocol.
If utility is what forces users to acquire a token, what specific forms does that utility take in practice?
Common Types of Token Utility
Modern token architectures generally combine several complementary utility roles across six core categories.
Payments
Transactional tokens serve as a direct medium of exchange inside decentralized marketplaces. Users exchange these tokens to purchase digital computational services, settle peer-to-peer invoices, or buy platform-specific goods.
Governance
Governance tokens allow holders to submit and vote on protocol parameters, such as software upgrades, risk collateral ratios, and treasury allocations. Modern analysts heavily discount pure governance tokens if voting rights lack a direct financial link to platform revenue or operational fees.
Staking
Staking mechanisms require users to deposit tokens into smart contracts to secure network consensus or back operational insurance pools. This utility removes liquid supply from open trading venues, directly reducing active market sell pressure. For instance, approximately 28% of all circulating Ethereum (ETH) amounting to roughly 34 million tokens—is locked in validation contracts to secure the base layer.
Fees
Protocol fees represent the baseline foundation of crypto utility. Blockchains like Ethereum and Solana (SOL) require users to spend native assets to bid for block space and execute transactions. Higher on-chain application volume directly translates to recurring transactional demand for the native asset.
Access
Access utilities function like digital memberships or API keys. Protocols require users to hold or lock a set balance to unlock discounted trading fees, access exclusive data streams, or tap premium software tools.
Collateral
High-liquidity tokens serve as foundational collateral within decentralized lending markets and synthetic asset engines. Borrowers lock up these assets to mint stablecoins or borrow other operational currencies, creating structural utility sinks.
While versatile utility creates a steady buyer pool, that demand means nothing if protocol creators dump billions of newly created tokens onto the market. That brings us to supply emissions.
What Are Token Emissions?
Token emissions represent the programmed schedule at which new tokens are created and released into active circulation. Emissions act identically to secondary stock offerings in equity markets, expanding the total supply and diluting existing holders if real demand fails to match issuance.
How New Tokens Enter Circulation
Protocol designers release new supply through three primary distribution pathways:
1. Validator and Miner Rewards: Blockchains mint new units per block to compensate participants who validate transactions and safeguard ledger security.
2. Liquidity Incentives: Decentralized applications distribute native tokens to yield farmers who deposit capital into decentralized exchange pools or lending markets.
3. Team and Investor Vesting: Private venture rounds and core development teams receive allocations that unlock on predetermined calendar dates.
A critical hazard in modern token analysis is the Fully Diluted Valuation (FDV) trap. When a project launches with only 10% of its total supply circulating, its market capitalization appears artificially modest while its FDV sits in the billions.
As the remaining 90% unlocks over time, structural sell volume overwhelms organic demand. Sound token designs maintain a circulating float of at least 40% at launch, supported by multi-year linear vesting curves rather than aggressive short-term unlock cliffs.
Once you know how tokens enter the market, you must examine how tokens exit it through burning.
What Is Token Burning?
Token burning is the deliberate, permanent removal of coins from active circulation by transferring them to an un-spendable null address. Once transferred to an “eater address” with no known private keys, those tokens can never be recovered, lowering the protocol’s accessible supply.
Minting vs Burning
Minting creates new supply out of code to incentivize network activity, while burning removes existing units to offset dilution. When the burning rate exceeds the minting rate, the token’s circulating supply contracts, creating programmatic scarcity.
The fundamental relationship follows a simple balance:
Net Token Supply Change = New Issuance (Emissions) − Destroyed Supply (Burns)
Understanding this relationship reveals whether an asset is genuinely designed to retain value over time.
Inflationary vs Deflationary Tokenomics
An inflationary token experiences a permanent, perpetual net expansion in its supply base. Bitcoin (BTC) uses a predictable issuance design governed by a hard cap of 21 million units and quadrennial halvings, meaning its rate of inflation predictably decreases toward zero over time.
In contrast, a deflationary token systematically shrinks its circulating balance through continuous burns. Ethereum implemented this via EIP-1559, destroying the base gas fee on every transaction while sending priority tips to validators.
However, deflation is never unconditional. When Layer 2 rollups reduce Layer 1 execution volume, mainnet fee destruction slows. For example, lower base fee consumption pushed Ethereum’s circulating supply to 122.06 million ETH, illustrating that an asset only turns deflationary when live transaction burns consistently outstrip validator rewards.
Similarly, central venues like Binance Coin (BNB) run systematic quarterly burns financed by corporate platform revenue, deliberately reducing an initial 200 million allocation toward a target ceiling of 100 million tokens.
Real deflation requires authentic market demand, leading to the crucial difference between organic and manufactured adoption.
Organic Demand vs Incentive-Driven Demand
Organic demand emerges when individuals buy a token because they genuinely need its core utility—such as paying block fees, accessing storage, or securing an on-chain enterprise service. Users surrender value willingly to consume the utility.
Incentive-driven demand is mercenary capital attracted solely by inflated percentage yields paid out in native tokens. Once token emissions slow or prices drop, liquidity providers exit immediately, dumping their rewards and leaving long-term holders with devalued assets.
This distinction determines whether a protocol captures real value or simply distributes paper wealth.
Tokenomics and Value Capture
Value capture measures how efficiently protocol usage and bottom-line revenue translate into economic benefits for token holders. A network can process billions in trading volume, but if that activity fails to route revenue back through buybacks, burns, or staking distributions, the native token will stagnate.
Protocols like Hyperliquid (HYPE) illustrate modern value capture by tying on-chain platform fees directly to asset absorption. In late September 2026, Hyperliquid produced nearly $4 million in platform revenue within a single 24-hour window, funneling those proceeds into open-market buybacks and programmatic token burns.
Contrast this with misleading “marketing burns,” where developers burn unissued, unsold treasury tokens. Destroying unsold tokens locked in a team vault creates zero purchasing support; authentic value accrual occurs only when circulating tokens are purchased off secondary markets using genuine platform revenues.
Now that we have covered the mechanisms, how do you audit an unfamiliar token step by step?
How to Analyze a Token’s Economic Design
Analyzing an unfamiliar asset requires an objective, repeatable research framework to confirm that structural demand outweighs supply unlocks.
12-Point Tokenomics Checklist
Run any prospective crypto investment through these twelve practical verification steps:
- Circulating Supply vs. FDV: Confirm circulating supply exceeds 40% of total supply to avoid high-FDV unlock dumps.
- Team and Investor Allocation: Check that insider, advisor, and private investor reserves remain below 30% of aggregate supply.
- Vesting Schedule Structure: Ensure team allocations unlock linearly over 3 to 5 years rather than through massive single-day cliff releases.
- Historical Emission Rate: Track daily token dilution against average secondary spot trading volume.
- Real Cash-Flow Linkage: Confirm whether protocol fees fund systematic market buybacks or token destruction.
- Staking Lock-Up Conditions: Check whether staking requires unbonding cooldown periods, preventing instant panic-selling.
- Utility Exclusivity: Verify whether platform actions strictly require the native token or accept generic stablecoins instead.
- Treasury Management Runway: Review public multi-signature wallet reserves to confirm the team holds at least two years of operating capital.
- Smart Contract Mint Rights: Read auditing reports to verify minting keys are provably burned, time-locked, or decentralized.
- Sink vs. Faucet Ratio: Calculate whether daily burn sinks absorb at least 80% of daily reward emissions under normal trading volume.
- Distribution Decentralization: Inspect blockchain ledger explorers to ensure the top ten non-exchange wallets hold under 20% of supply.
- Exchange Liquidity Depth: Confirm healthy spot market liquidity across major venues to ensure steady unlock absorption.
| Step | Metric to Evaluate | Ideal Scenario | Critical Red Flag |
| 1 | Float-to-FDV Ratio | Circulating supply is >40% at launch. | Circulating supply <15% with multi-billion FDV. |
| 2 | Insider Vesting | Linear release spanning 36 to 60 months. | Massive cliff unlocks (>25% of supply) within 12 months. |
| 3 | Value Accrual | Verifiable protocol fees fund buybacks or burns. | Circular reward incentives minted out of thin air. |
| 4 | Structural Demand | Asset required for gas, validation, or access. | Pure governance utility with no revenue integration. |
Tokenomics Red Flags
Walk away from any crypto asset exhibiting these four economic warning signs:
- Cliff Unlocks Exceeding 10% of Daily Volume: A sudden injection of seller supply will quickly break order book depth.
- Triple-Digit Inflation Yields: Any protocol paying 200% staking yields is actively debasing its native currency to hide capital flight.
- Opaque Founder Wallets: Unlabeled developer treasuries moving assets to centralized exchanges without prior community notice.
- Vanity Burns: Destroying billions of unreleased reserve tokens while avoiding open-market asset repurchases.
Final Framework
Successful tokenomics analysis strips away marketing hype to measure one simple formula: Sustainable Demand minus Structural Dilution. When a project builds indispensable utility, captures real protocol cash flows, and minimizes insider emissions, its token possesses the foundation to appreciate over long market horizons.
Frequently Asked Questions
What is the difference between Market Cap and Fully Diluted Valuation (FDV)?
Market Cap is the current price multiplied by tokens actively circulating in the open market today. Fully Diluted Valuation (FDV) is the price multiplied by the maximum theoretical supply that will ever exist once every token unlocks.
Are all token burns good for price appreciation?
No, only buyback burns that purchase circulating tokens off open trading books directly help asset pricing. Destroying unissued tokens stored in internal reserve wallets has zero direct impact on active market supply.
How does high inflation harm long-term token holders?
High inflation continuously multiplies circulating units, requiring substantial new capital just to maintain price equilibrium. If market demand stays flat while supply doubles, each individual token’s purchasing power drops by half.
Why is pure governance utility considered risky?
Pure governance gives you voting input over proposals, but without a fee-switch or direct dividend model, it distributes zero operational earnings. When trading enthusiasm wanes, non-revenue tokens typically experience severe price drawdowns.
ZenvestAI View
At ZenvestAI, our core view is that tokenomics serves as the balance sheet of the decentralized economy. Just as an equity investor never purchases shares without inspecting shares outstanding and dilution tables, a crypto investor must never commit capital without dissecting vesting schedules, daily emission run rates, and programmatic burns. Token designs that rely on continuous token printing to generate artificial activity eventually fail. The future belongs to lean protocols operating with transparent, non-inflationary cash-flow distribution.
The Bottom Line on Token Utility, Emissions & Burns Explained: How to Analyze Crypto Tokenomics
Sustainable crypto value requires real protocol earnings and tight supply control; if structural emissions outstrip genuine utility demand, price declines are mathematically inevitable.
Related Intelligence & Verified Sources
- Review live decentralized exchange buyback reserves and daily fee generation on DefiLlama.
- Audit upcoming token unlocks, vesting schedules, and allocation cliff dates on Tokenomist (formerly TokenUnlocks).
- Track active multi-asset market benchmarks and crypto market indices via the S&P Dow Jones Indices Digital Market Portal.
- Monitor on-chain Ethereum issuance and EIP-1559 base fee burning dynamics on Ultrasound Money.
Author & Editorial Information
Authored by Deepak Kumar, Senior Digital Asset Researcher at ZenvestAI. Reviewed by the ZenvestAI Quantitative Research & Tokenomics Desk.
Regulatory Disclosure: This article is published exclusively for educational and informational purposes under international financial communication standards, including guidelines set forth by the International Organization of Securities Commissions (IOSCO), the U.S. Securities and Exchange Commission (SEC), and the European Union Markets in Crypto-Assets (MiCA) regulation. Nothing contained within this publication constitutes financial, legal, investment, or tax advice. Cryptocurrency assets carry high volatility and significant risk of total capital loss. Always perform comprehensive independent due diligence before executing transactions in digital markets.