Are you tired of buying the dip only to watch the price keep falling? Most crypto investors experience this frustration because they fly blind. They rely entirely on lagging price charts and social media hype, completely missing the real-time capital moving beneath the surface. When you cannot see what the largest market participants are doing, you risk becoming exit liquidity for smart money.
My Real Trading Experience: When I Thought SAGA Would Go Up
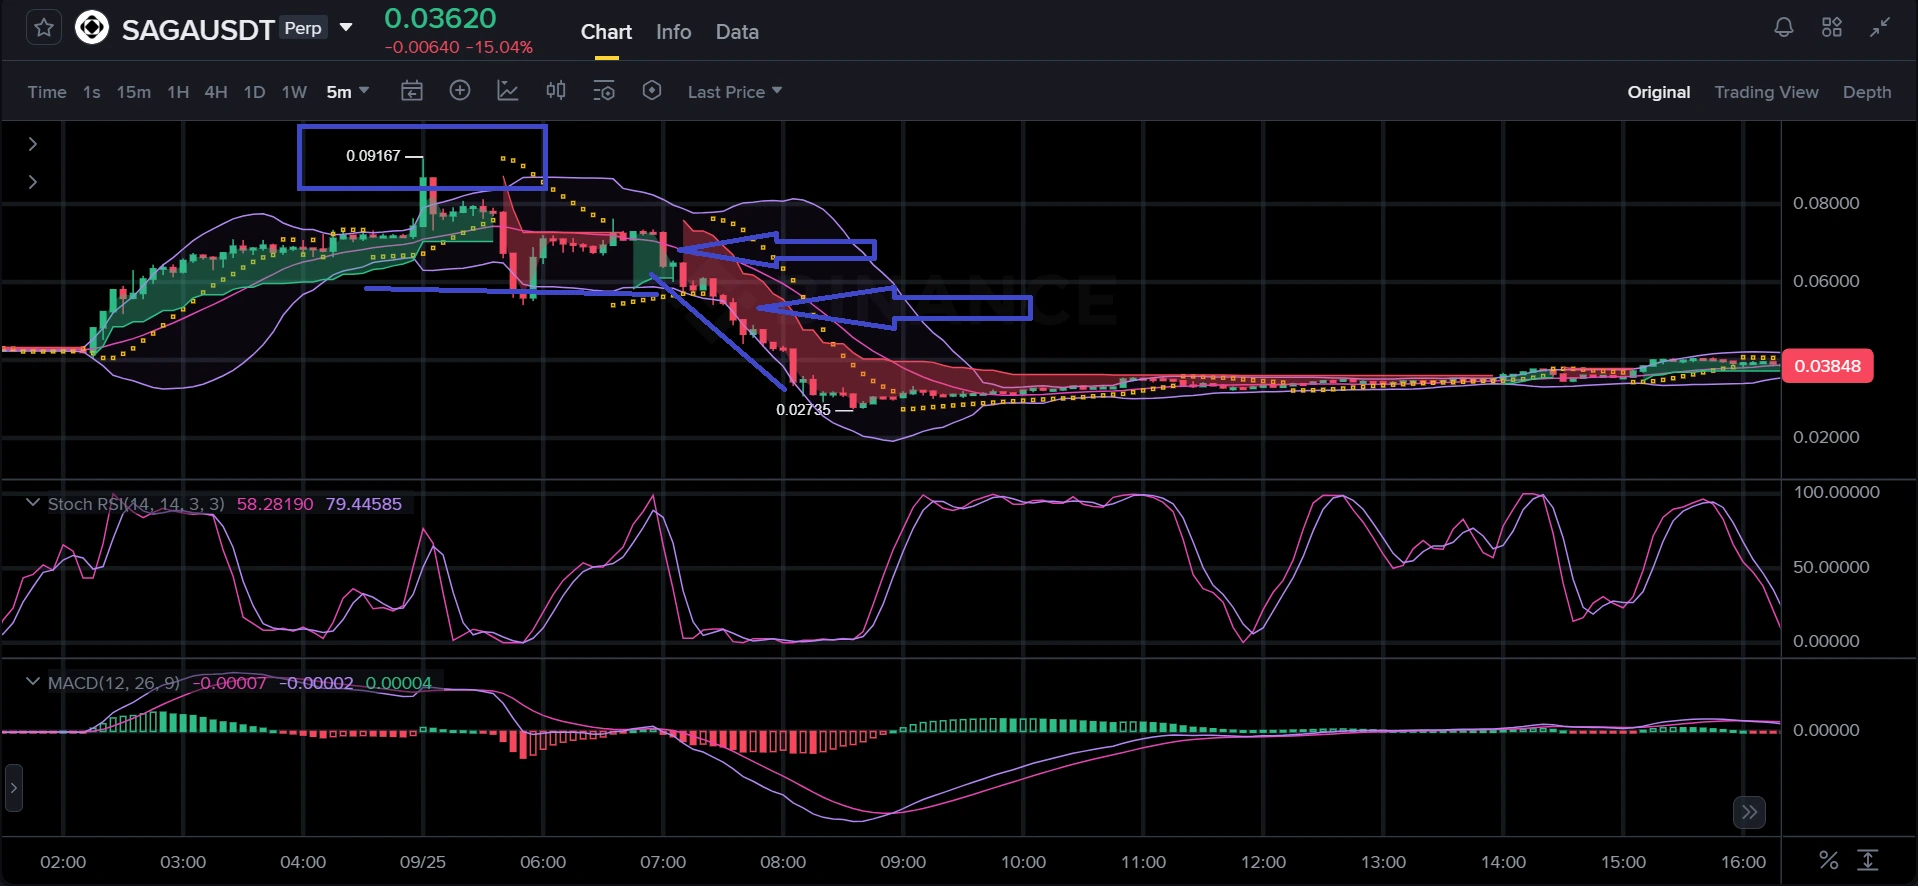
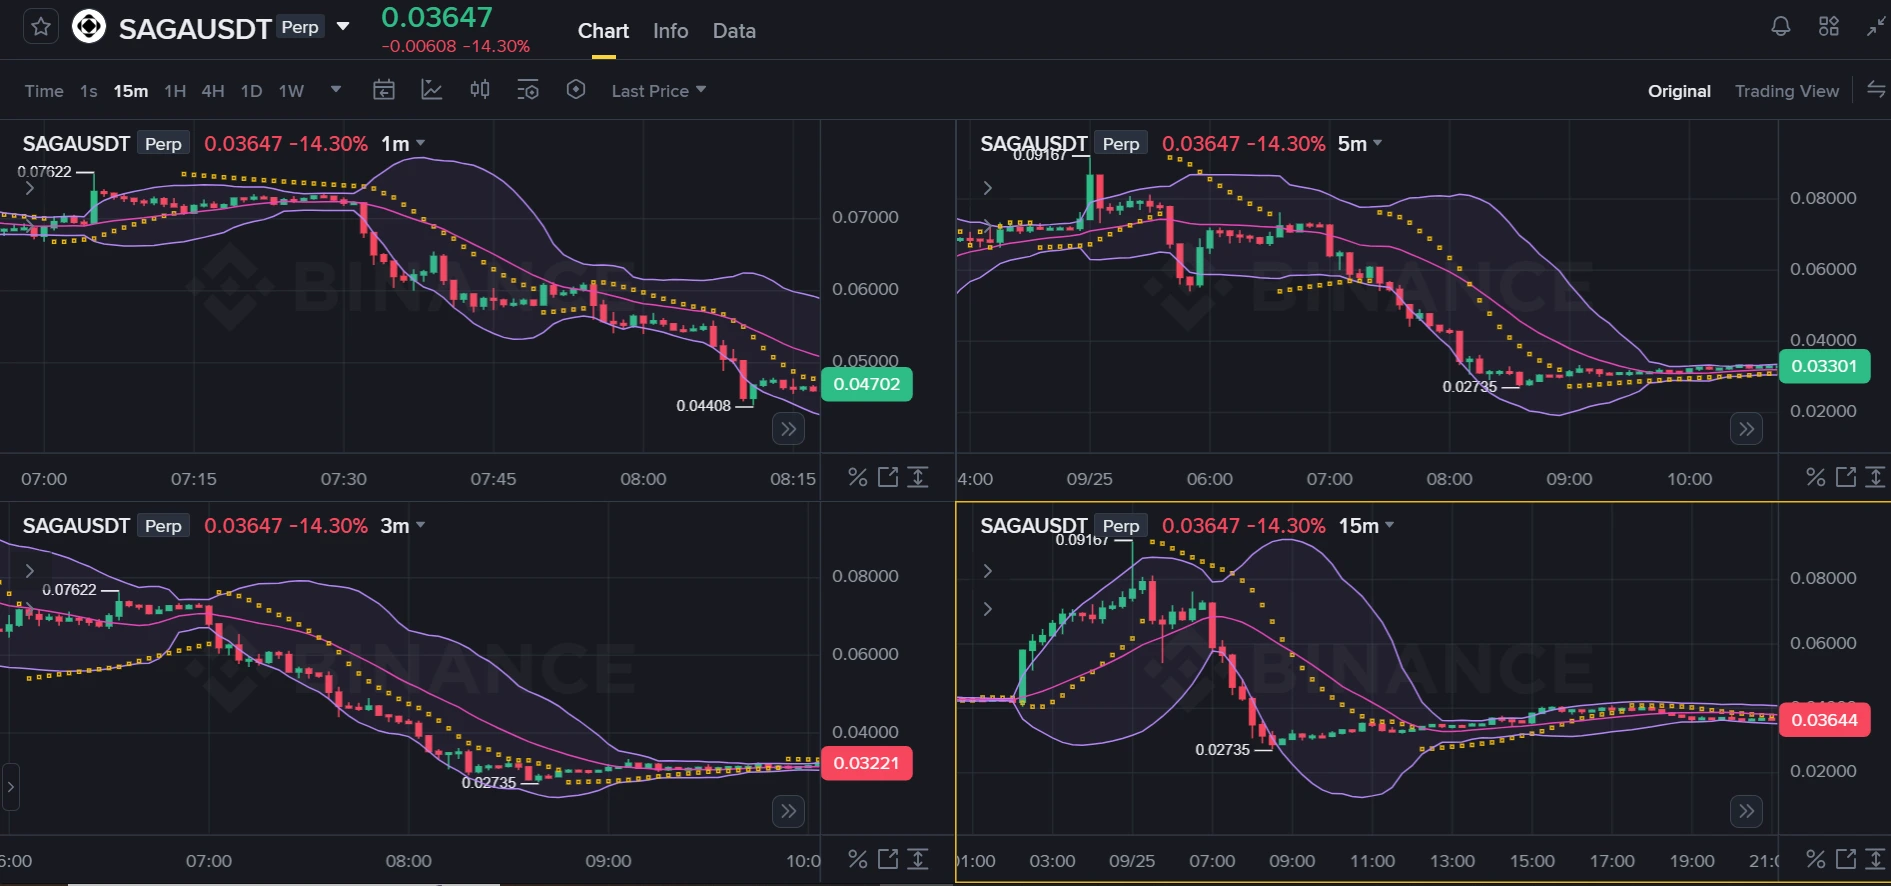
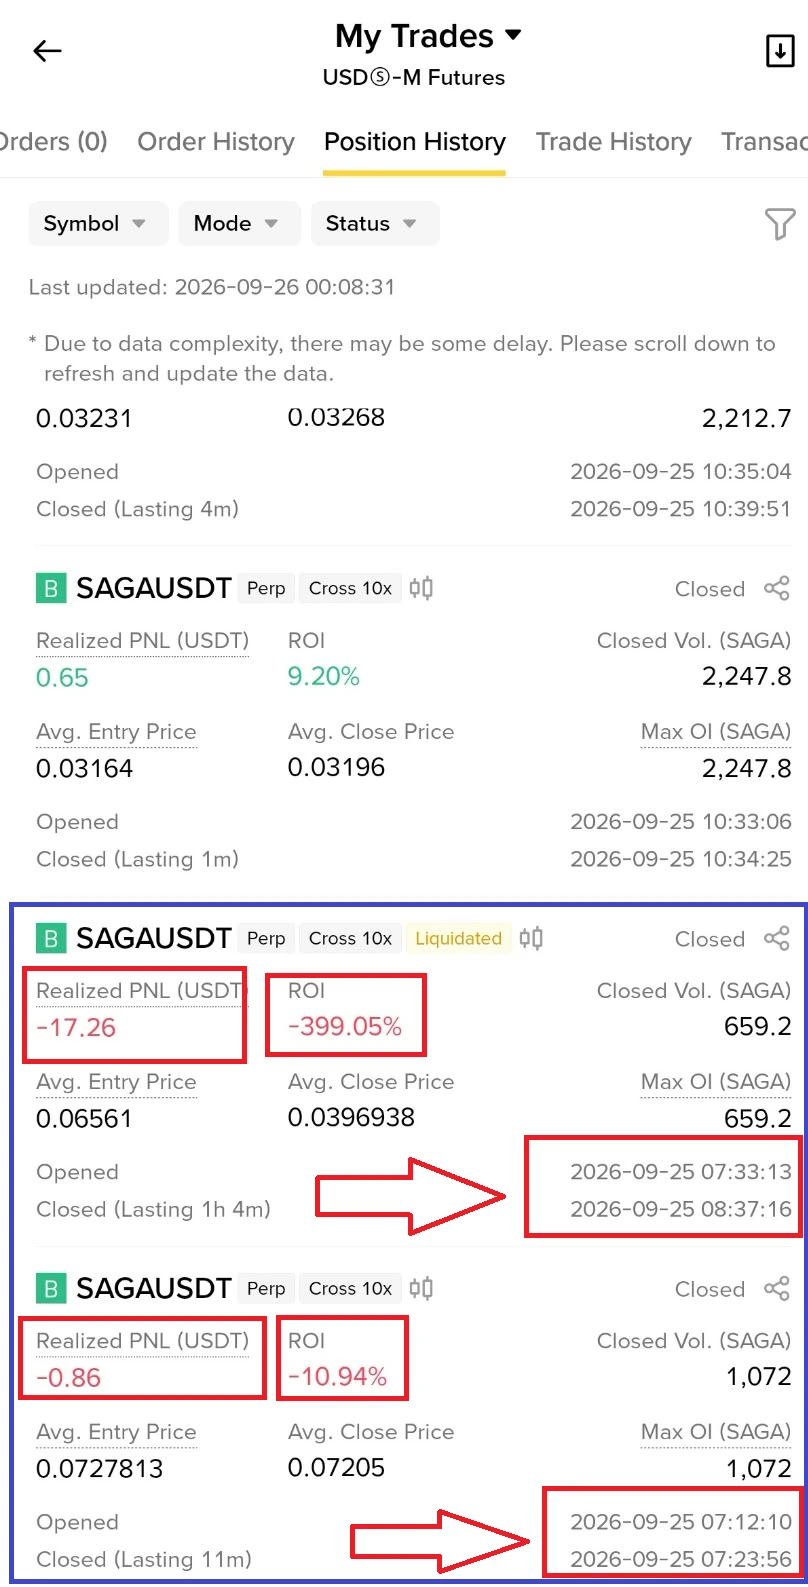
On 25 September 2026, around 7:30 AM, I entered a trade on SAGAUSDT Perpetual around $0.065. My thinking was simple: the price had previously reached around $0.091, so I believed it could move higher again. I expected the previous high to act as a reference point and thought there was a possibility of another upward move.
But the market had a different plan. After I entered, the price started moving down. Instead of accepting the loss and following my original risk plan, I made one of the biggest mistakes a trader can make. I removed my stop-loss.
I kept thinking:
“It will come back.”
Then:
“It has already fallen so much. It should bounce now.”
And again:
“Maybe I should wait a little longer.”
But the bounce I was expecting never came. The price continued falling, eventually reaching around $0.02735 on the chart.
The Most Important Part Was Not the Loss
Fortunately, my trading capital in this particular trade was relatively small, so I was not emotionally devastated by the loss. In fact, I had been making profits for the previous four days, and that probably influenced my thinking. I started believing:
“I have been winning for four days, so today I should also win.” That mindset was dangerous. A few profitable days do not mean the next trade will be profitable. The market does not know that I won yesterday. It does not know that I made money for four consecutive days.
And it certainly does not owe me another winning trade. This experience reminded me that past profits can sometimes create overconfidence, while a losing position can make a trader hold on even longer because they want to prove that their original analysis was correct.
What I Should Have Asked Before Entering
Instead of looking only at the previous price high of $0.091, I should have asked much more important questions.
For example:
- What was happening with the number of active addresses?
- Was transaction activity increasing or decreasing?
- Were large wallets accumulating or distributing?
- Were tokens moving toward exchanges?
- Was exchange inflow increasing?
- Was network activity supporting the price?
- Was liquidity strong enough to support the move?
- Was the token experiencing significant selling pressure?
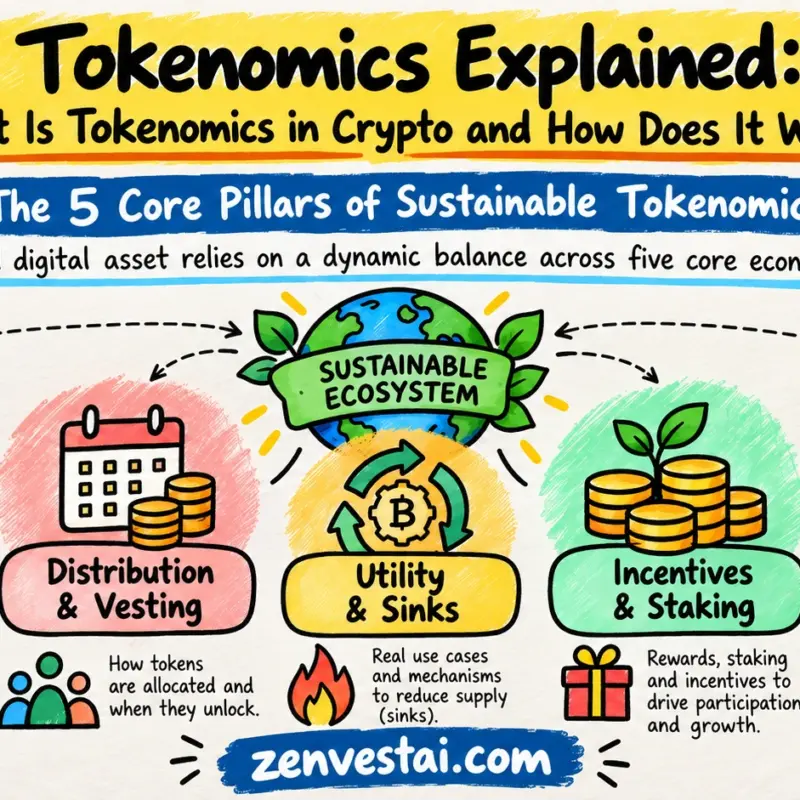
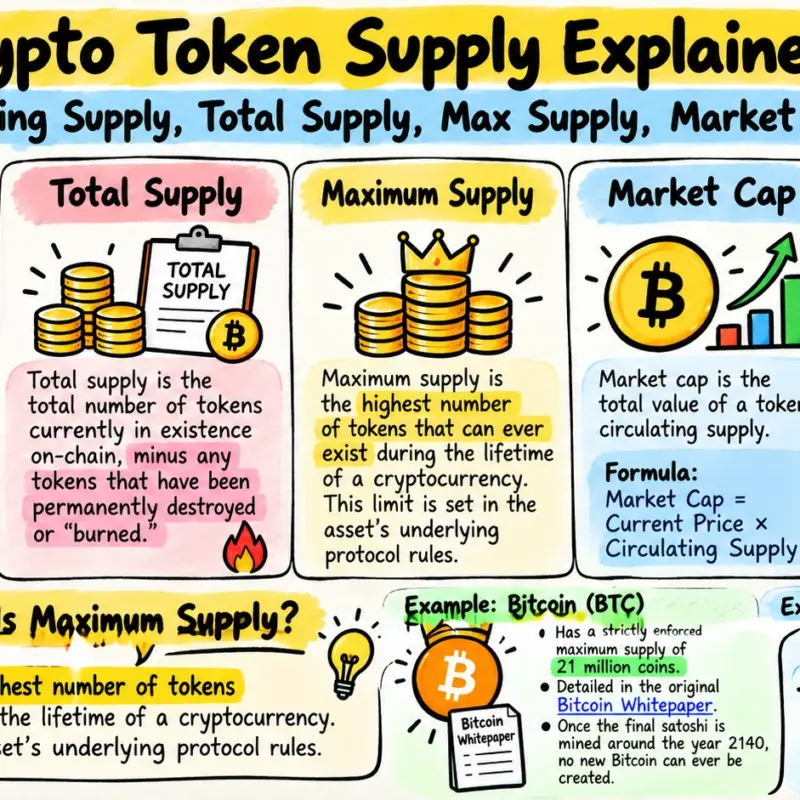
- What was happening with circulating supply and token unlocks?
- Was the market actually showing fundamental demand?
This is where on-chain analysis becomes important. A chart tells me what price has done. On-chain data can help me investigate what is happening underneath the price. But it is important to understand that on-chain analysis is not a crystal ball. Strong on-chain activity does not guarantee that a token’s price will rise, and weak activity does not automatically guarantee a decline. It is another layer of evidence that should be combined with market structure, liquidity, tokenomics, risk management, and other relevant information.
What This Loss Taught Me About On-Chain Analysis
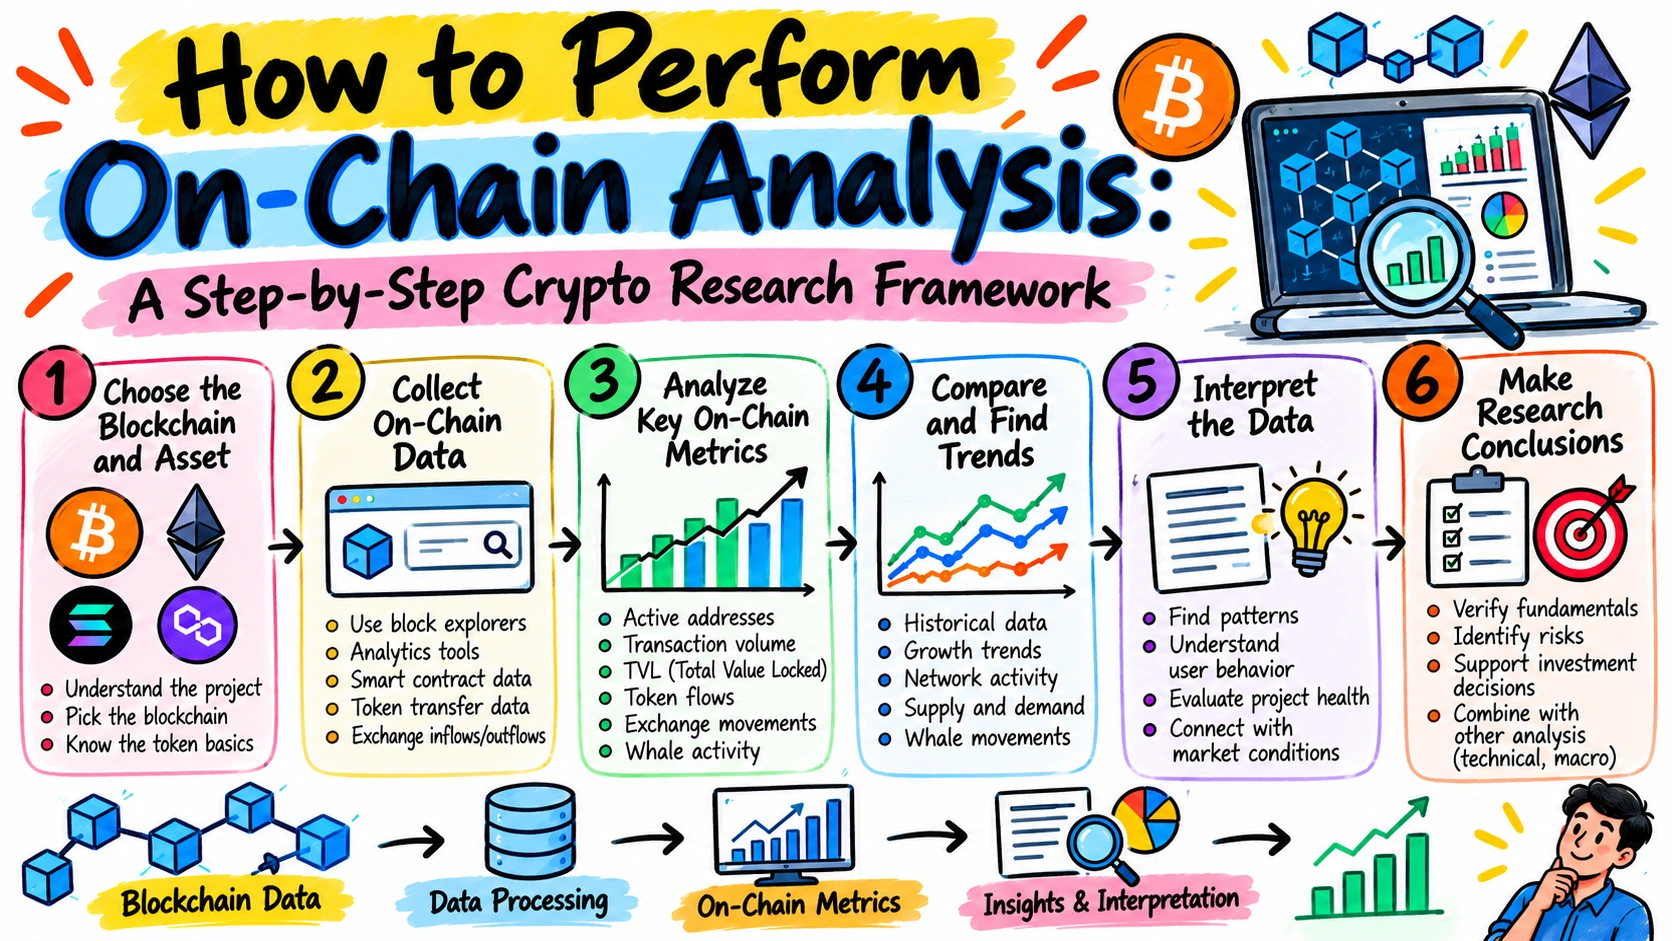
This trade became a practical reminder of why I am writing “How to Perform On-Chain Analysis: A Step-by-Step Crypto Research Framework.” The purpose of the article is not to tell anyone:
“Use on-chain analysis and you will never lose money.”
That would be unrealistic. Instead, the goal is to explain how blockchain data can be investigated systematically before making a research or trading decision. The framework will walk through questions such as:
Step 1 — Identify the asset and blockchain
Understand what you are actually analyzing.
Step 2 — Collect blockchain data
Look at transactions, addresses, token movements, smart-contract activity, exchange flows, and other available data.
Step 3 — Study important on-chain metrics
Analyze active addresses, transaction volume, whale activity, exchange flows, TVL, token movements, and network activity where relevant.
Step 4 — Compare historical trends
One data point is rarely enough. Compare current activity with previous periods.
Step 5 — Interpret the data carefully
Ask what the numbers may indicate instead of immediately assuming that they predict price.
Step 6 — Combine on-chain evidence with market analysis
Use on-chain information alongside price structure, liquidity, tokenomics, macro conditions, and risk management.
One More Lesson: Never Remove a Stop-Loss Because You Hope
For me, the biggest lesson from this trade was actually not about SAGA. It was about my own decision-making. I entered because I believed the price could recover toward its previous high. When the trade moved against me, instead of reassessing the original thesis, I removed my stop-loss and started hoping.
That changed the trade from a planned risk into an uncontrolled loss. This is something I want to examine honestly in this article because understanding blockchain data is only one part of crypto research. Data can improve your analysis, but discipline determines how you respond when your analysis is wrong. And sometimes the most valuable lesson from a trade is not the profit you made. It is the mistake you understand well enough not to repeat.
A Note for Readers
If you have questions about any part of the on-chain analysis process, or if you want me to explain a particular metric, methodology, or example in more detail, drop me a message or send an email. I can then explain the specific part of the research process more minutely and add practical examples where they help.
This article is based partly on my own trading experience and is intended for educational and research purposes. It is not a guarantee of future price movements or a recommendation to buy or sell any cryptocurrency.
ZenvestAI Quick Answer
On-chain analysis solves this information gap by directly evaluating a blockchain’s public, immutable ledger to uncover user activity, capital flows, and network valuation. Unlike traditional financial markets where institutional order flow remains hidden inside dark pools, public blockchains give every retail and institutional investor direct access to supply shifts, economic velocity, and whale movements. By executing a structured eight-step framework, you can read these ledger footprints to anticipate macro market pivots before they appear on standard price charts.
Table of Contents
How to Perform On-Chain Analysis: A Step-by-Step Crypto Research Framework
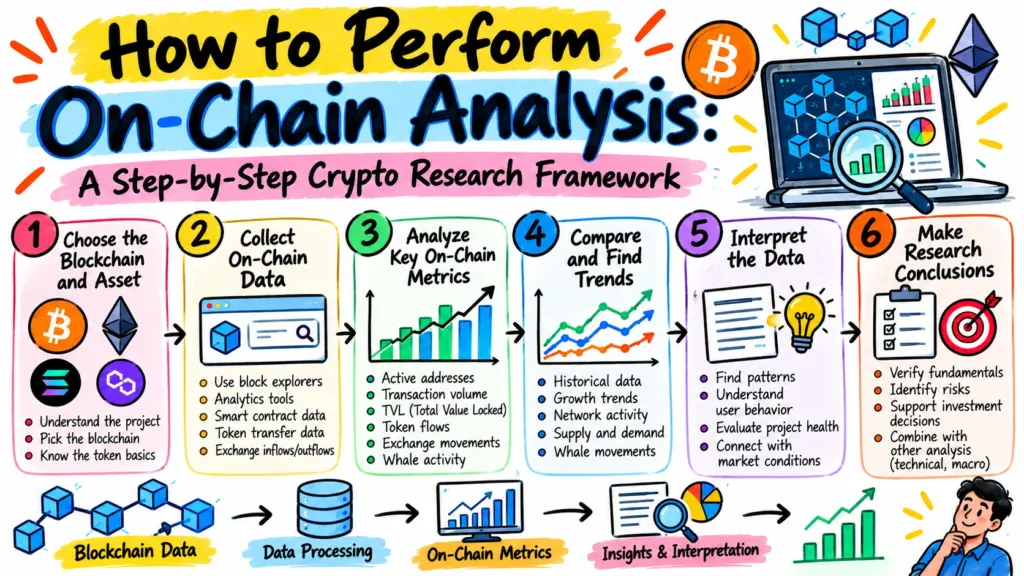
This guide provides a professional research system that walks you from initial asset selection to final trade thesis execution. You will master how to audit network health, calculate real holder profitability, spot institutional whale accumulation, and identify dangerous market divergences.
Why This Matters Now
Real-time economic activity on public blockchains has scaled into a multi-trillion-dollar parallel economy. According to the 2026 Global Crypto Adoption Index by Chainalysis, total annual on-chain transaction volume globally stands resilient at $9.4 trillion, with stablecoins accounting for 22.5% of active on-chain value.
Relying solely on delayed technical indicators in such a high-velocity environment leaves you vulnerable to sudden liquidity shocks. Understanding how to query and interpret raw ledger data is no longer a luxury for specialized hedge funds; it is the fundamental baseline for risk mitigation and capital preservation.
What You Need Before Starting
Before running your first query, ensure you have the proper analytical workspace ready:
- Analytical Data Aggregators: Free or paid accounts on major on-chain analytics platforms such as Glassnode, CryptoQuant, Artemis, Token Terminal, or DeFiLlama.
- Clear Thesis Documentation: A dedicated notebook or spreadsheet to track weekly data shifts across baseline metrics.
- Basic Ledger Literacy: An understanding that a blockchain address is not an individual person, but a cryptographic identifier that can belong to an automated contract, an exchange hot wallet, or a private saver.
Step 1: Define the Asset and Timeframe
Select the specific asset sector you are investigating and lock in your analytical evaluation window.
Every effective on-chain research session requires strict asset parameters. You cannot evaluate a digital reserve asset like Bitcoin (BTC) using the same criteria as an infrastructural smart-contract layer like Ethereum (ETH), a decentralized finance governance token, or a yield-bearing stablecoin.
Similarly, your timeframe dictates your metric selection. A short-term swing trade requires monitoring immediate exchange netflows and derivative liquidations, while a multi-year investment thesis requires studying dormant coin destruction and long-term holder supply concentration.
What You Should See
A clear, documented research statement specifying the asset ticker, the asset category (Layer-1, DeFi, or Store of Value), and your designated investment horizon (30-day tactical, 6-month cyclical, or 3-year macroeconomic).
Common Mistake
Applying DeFi metrics like Total Value Locked (TVL) to monetary assets like Bitcoin, or using 2-year macro metrics like the MVRV Z-Score to execute 24-hour day trades.
Next Natural Question: Once your asset and timeframe are locked, how do you verify that anyone is actually using the underlying blockchain?
Step 2: Check Network Activity
Audit the baseline transaction pulse of the network by measuring active users, fees, and transfer volume.
Network activity acts as the fundamental heartbeat of any cryptographic network. Healthy protocols display consistent, organic expansion across four core vital signs: daily active addresses, total transaction counts, total network transaction fees, and gross transaction volume.
When computing metrics, distinguish between temporary speculative spikes (such as an airdrop claim or meme-token minting frenzy) and sustained structural adoption. Protocols scaling efficiently should show expanding transaction throughput alongside stable or declining median fees.
What You Should See
A steady or upward-sloping 30-day moving average of daily active addresses and organic transaction volume, indicating healthy adoption without network congestion.
Common Mistake
Mistaking a massive, single-day spike in address creation for genuine adoption, when it is frequently sybil activity generated by automated bots hunting for protocol rewards.
Next Natural Question: If the network shows active usage, where is the underlying circulating supply currently moving?
Step 3: Examine Exchange Flows
Monitor token movements across centralized exchange deposit and withdrawal contracts.
Exchange flows reflect immediate market supply and demand. By isolating exchange addresses, on-chain analysts classify token transfers into three vital metrics: exchange inflows, exchange outflows, and netflows (inflows minus outflows).
When massive volumes of an asset enter exchange deposit wallets, it indicates imminent sell pressure, as investors generally move funds to centralized platforms to execute sales. Conversely, when sustained exchange outflows occur, tokens are being moved to cold storage hardware wallets or decentralized staking contracts, causing liquid spot supply to dry up. Furthermore, rising stablecoin balances parked on exchanges indicate capital standing by as liquid dry powder.
What You Should See
Sustained net negative exchange balances over a 14- to 30-day rolling window during healthy accumulation phases.
Common Mistake
Failing to recognize internal exchange wallet restructuring. Exchanges regularly transfer billions of dollars between their own internal cold and hot storage systems; automated alerts often misinterpret these internal transfers as sudden market deposits or withdrawals.
Next Natural Question: Now that you see tokens leaving exchanges, who is actually accumulating and storing them?
Step 4: Analyze Holder Behavior and Supply Concentration
Segment the holder base into behavioral cohorts based on wallet balance and holding duration.
A small fraction of large-scale market participants controls the majority of liquid cryptocurrency. Professional on-chain analysis segments the supply into distinct cohorts: whales (wallets holding more than 1,000 coins), long-term holders (addresses holding coins unspent for longer than 155 days), and short-term holders (market participants holding coins for under 155 days).
When long-term holders consistently increase their balance while prices fluctuate sideways, it reveals silent accumulation by high-conviction capital. Additionally, monitoring dormant supply—coins that have remained motionless for several years—helps you gauge whether early protocol insiders and legacy funds are holding tight or offloading into liquidity spikes.
What You Should See
Rising aggregate balances held by long-term holder cohorts alongside flat or declining whale exchange deposits.
Common Mistake
Assuming every 10,000-coin wallet is an individual whale. Many mega-wallets represent institutional custody providers, ETF backing reserves, bridge contracts, or exchange omnibus accounts holding funds on behalf of hundreds of thousands of retail depositors.
Next Natural Question: If long-term holders are keeping their tokens parked, are they currently sitting on profits, or are they under severe financial stress?
Step 5: Examine Realized Profit and Loss
Calculate the aggregate cost basis of the market using realized value metrics.
Spot market capitalization merely multiplies the circulating supply by the latest traded market price. In contrast, on-chain analysis calculates realized capitalization, which values each individual coin at the exact price it was last moved between blockchain addresses.
Comparing spot valuation against realized cost basis unlocks essential cyclical gauges:
- MVRV Ratio (Market Value to Realized Value): Compares spot market cap to realized market cap. Historically, an MVRV below 1.0 indicates that the market is underwater on aggregate, marking generational accumulation opportunities. An MVRV climbing above 3.5 signals extreme paper profits and cycle-top territory.
- SOPR (Spent Output Profit Ratio): Measures whether spent coins are moving at a profit or a loss. A SOPR value above 1.0 means holders are selling at a profit; a value below 1.0 indicates realized losses.
- NUPL (Net Unrealized Profit/Loss): Evaluates the total amount of unrealized gain or loss stored within the circulating network supply.
What You Should See
During bear market bottoms, MVRV prints values below 1.0 as the majority of participants surrender their positions at a realized loss. During mid-cycle retests, SOPR repeatedly bounces off the 1.0 level as investors refuse to sell below their break-even point.
Common Mistake
Relying on raw MVRV values for brand-new tokens with less than two years of trading history. Assets require complete market cycles for realized capitalization to establish dependable statistical baselines.
Next Natural Question: Once you know the aggregate profit state of holders, is the asset’s overall market price fundamentally justified by its utility?
Step 6: Compare Network Activity With Market Valuation
Cross-reference on-chain transaction volume and protocol revenue directly against circulating market capitalization.
Price should ultimately reflect economic utility. The NVT Ratio (Network Value to Transactions), often dubbed crypto’s Price-to-Earnings (P/E) equivalent, divides market capitalization by daily transaction volume transmitted on-chain according to Glassnode’s NVT Metric Framework.
A high NVT ratio implies that market capitalization has outpaced the monetary utility of the network, signaling speculative overextension. Conversely, a low NVT ratio suggests that the network is clearing immense economic volume relative to its current market price. For smart-contract protocols and decentralized applications, compare Total Value Locked (TVL) and actual protocol revenue directly to fully diluted valuation (FDV).
What You Should See
An NVT ratio trending lower or staying flat while market capitalization grows, indicating that real economic throughput is keeping pace with asset price.
Common Mistake
Comparing Layer-1 base chains directly against decentralized applications using the same NVT formula without adjusting for off-chain Layer-2 batch settlements or protocol-specific staking lockups.
Next Natural Question: How do you verify your on-chain findings against what is happening right now in live derivatives and order books?
Step 7: Compare On-Chain Data With Market Derivatives
Layer your ledger findings against spot volume, derivatives open interest, and funding rates.
On-chain data reveals structural supply shifts, but spot and derivatives markets control immediate short-term price discovery. When a structurally bullish on-chain setup develops, it can still experience severe short-term drawdowns if the derivatives market becomes over-leveraged.
Review the market’s perpetual funding rates and open interest. If funding rates are deeply positive and open interest is hitting all-time highs while price approaches resistance, an aggressive long-squeeze can trigger a liquidation cascade, temporarily overriding fundamentally bullish on-chain accumulation.
What You Should See
Healthy spot-driven rallies characterized by neutral or slightly positive funding rates alongside declining exchange balances.
Common Mistake
Treating on-chain analysis as a replacement for market structure. Derivatives leverage determines immediate volatility; on-chain data determines the broader directional path of least resistance.
Next Natural Question: Where do you find the most lucrative, asymmetric risk-to-reward setups when combining these datasets?
Step 8: Identify and Capitalize on Divergences
Spot high-conviction discrepancies where spot price action directly contradicts underlying on-chain indicators.
Market alpha emerges when market sentiment and on-chain metrics point in opposite directions. These conditions are called divergences.
Consider the four primary on-chain divergences:
- Bullish Accumulation Divergence: Price prints lower lows over several weeks, but active addresses rise, exchange balances drop sharply, and whale balances trend upward. Smart money is quietly absorbing panic-selling at a discount.
- Bearish Distribution Divergence: Price continues setting higher highs, driven by momentum or speculative narratives, but daily active addresses, transaction fees, and transfer volume steadily decline. The rally lacks real fundamental network support.
- Structural Supply Shock: Liquid exchange supply plummets to multi-year lows while stablecoin reserves surge, creating a supply-demand imbalance where any sudden influx of buying pressure forces rapid upward repricing.
- Cycle Exhaustion Signal: Price pushes into fresh all-time highs while long-term holder balances collapse and SOPR records unprecedented spikes, indicating that long-term investors are distributing their holdings into retail hype.
What You Should See
A clear statistical divergence sustained across a minimum of two weeks on a 7-day or 14-day simple moving average.
Common Mistake
Entering maximum leverage immediately upon spotting a divergence. Divergences can take weeks or even months to resolve as irrational market sentiment often persists longer than expected.
Practical Walkthrough: The “ZenChain” Analysis Case Study
To see how this framework functions under live market conditions, walk through a concrete scenario involving a fictional Layer-1 smart contract platform called ZenChain.
The Scenario
ZenChain’s spot token price has plummeted 24% over three weeks, sliding from $45.00 down to $34.20. Social media sentiment is overwhelmingly negative, with commentary claiming the network is dead.
Step-by-Step Ledger Audit
Rather than selling in a panic, you open your analytical dashboard and work through the framework:
The 30-day on-chain data for ZenChain points to a textbook accumulation phase, characterized by retail capitulation and smart money absorption against a backdrop of growing network utility.
Network Fundamentals
Network usage is diverging positively from price action and profitability. An 18% increase in Daily Active Addresses (142,000 to 167,500) paired with a 12% rise in transactions indicates genuine ecosystem growth and utility, rather than pure speculative trading (which typically drops off when retail exits).
Supply & Accumulation
A localized supply shock is forming. Net outflows of 420,000 tokens have drained available exchange reserves by 6.4%, significantly reducing immediate sell pressure. The cohort data confirms the transfer of wealth: “smart money” wallets holding over 10,000 tokens increased their balances by 8.2%, directly absorbing the distributed supply from retail wallets (which declined by 14%).
Cycle Profitability
SOPR: Prints 0.94 (Capitulation at a loss)
The drop in MVRV to 0.92 means the aggregate market has transitioned into unrealized loss territory—the average token is now valued lower than when it was last moved. Paired with a sub-1.0 SOPR, this confirms active capitulation: retail holders are selling tokens at a realized loss. Historically, an MVRV below 1.0 combined with rising network fundamentals signals a high-conviction bottoming formation.
Analytical Synthesis and Outcome
- Utility is Expanding: Daily active addresses grew by 18%, proving that network utility is expanding despite the price drop.
- Supply is Leaving Exchanges: Over 420,000 tokens departed centralized exchanges into non-custodial staking contracts, reducing liquid supply.
- Whales are Absorbing Liquidity: Cohorts holding more than 10,000 tokens accumulated aggressively, absorbing panic-selling from retail accounts.
- Valuation is Sub-1.0: ZenChain’s MVRV dropped to 0.92, confirming that the asset is trading below the aggregate network purchase cost.
You identify a clear bullish accumulation divergence. While retail traders sold at a loss out of fear, on-chain metrics proved that smart money was accumulating an expanding network at a substantial discount. Within seven weeks, as derivatives leverage cleared, ZenChain recovered to $52.00, generating a 52% recovery gain for analysts who trusted ledger evidence over market sentiment.
The Simple On-Chain Research Dashboard
Use this structured reference matrix to organize your weekly research routines:
| Research Layer | Primary Metrics | Core Analytical Question | Bullish Signal | Bearish Signal |
| 1. Network | Active Addresses, Daily Tx Count, Gas Fees | Is protocol usage expanding or contracting? | Addresses & transactions trending upward | Declining activity during price increases |
| 2. Flows | Inflows, Outflows, Netflows, Exchange Reserves | Where is liquid supply moving? | Multi-week net exchange outflows | Large, sustained exchange deposit spikes |
| 3. Holders | Whale Cohorts, Long-Term vs Short-Term Supply | Who is currently controlling the supply? | Long-term holders accumulating supply | Whales distributing tokens into rallies |
| 4. Profitability | MVRV Ratio, SOPR, NUPL | Are investors realizing gains or losses? | MVRV < 1.0; SOPR resetting near 1.0 | MVRV > 3.5; massive SOPR profit spikes |
| 5. Valuation | NVT Ratio, TVL vs Market Cap, Fee Multiples | Does network utility justify the token price? | NVT trending lower as price stabilizes | High NVT paired with declining transaction utility |
| 6. Market | Spot Volume, Open Interest, Funding Rates | Is derivatives leverage creating hidden risks? | Negative funding rates during accumulation | Overheated funding rates alongside high leverage |
Common Problems and How to Fix Them
1. Conflicting On-Chain Signals
- The Problem: You observe massive exchange inflows (bearish), but network transactions and active addresses are simultaneously reaching fresh highs (bullish).
- The Fix: Zoom out your timeframe. Daily metrics are volatile and frequently clouded by temporary transactional noise. Switch your dashboard charts to a 30-day or 90-day Simple Moving Average (SMA) to filter out intraday anomalies and reveal the broader structural trend.
2. Exchange Internal Wallet Restructuring
- The Problem: An automated tracking service tweets that a crypto exchange just received an inflow of 50,000 BTC, causing sudden market anxiety.
- The Fix: Check the receiving wallet’s label on a block explorer like Etherscan or an aggregator like CryptoQuant. If the transfer occurred between two verified addresses belonging to the same exchange operator, it is merely an internal accounting reorganization between cold vaults and hot settlement wallets, not an external market deposit.
3. Low-Liquidity Altcoin Data Distortion
- The Problem: You attempt to run an MVRV and NVT analysis on a micro-cap altcoin with only three months of trading history, resulting in erratic, meaningless chart outputs.
- The Fix: On-chain valuation metrics require extensive multi-year historical distribution to establish statistically reliable baselines. For newer tokens, bypass macro valuation ratios and focus strictly on DEX liquidity pool depth, contract deployer wallet activity, and token unlock schedules.
Security Tips and Risk Warnings
- Beware of Single-Indicator Bias: Never open a trade or make an allocation based on a single on-chain metric. A low MVRV ratio does not prevent an asset from falling another 30% if broader macroeconomic liquidity contracts. Always confirm your thesis across network activity, flows, and market structure.
- Watch Out for Sybil Token Mints and Wash Volume: Low-fee blockchains can be artificially manipulated by automated scripts pinging smart contracts back and forth. Always verify transaction counts against total transaction fees paid in native currency to confirm whether users are spending real economic capital to interact with the chain.
- Separate Gross Yield from Net Reality: When reviewing on-chain decentralized finance yields, never accept advertised Annual Percentage Yields (APY) at face value. Advertised yields rarely account for liquidity pool impermanent loss, smart contract vulnerability premiums, and high transaction gas costs on base layers.
Fees and Analytical Costs
- Entry-Level Research ($0 / month): You can execute the majority of this framework without spending money. Platforms like DeFiLlama, Artemis, Token Terminal, and the free public tiers of Glassnode provide access to active addresses, exchange balances, total volume, and baseline NVT ratios.
- Professional Analytical Suites ($30 to $800 / month): Advanced capabilities—such as real-time block-by-block institutional alerts, entity-adjusted whale cohort clustering, advanced miner reserve balances, and automated API data feeds—require premium subscriptions to platforms like Glassnode Professional or CryptoQuant Enterprise. Beginners should consistently practice on free, delayed daily charts before purchasing institutional tools.
What to Do After Completing Your Analysis
Once you have gathered your metrics and identified a clear market divergence, take these follow-up steps:
- Document Your Analytical Hypothesis: Record your exact readings for active addresses, exchange netflows, MVRV, and derivatives funding rates in a research log alongside the current spot price.
- Establish Risk Parameters: Determine your invalidation level. If your thesis is based on whale accumulation above a specific cost basis, identify the price point where that thesis is invalidated.
- Set Up Automated Metric Alerts: Configure automated balance alerts for key exchange custody addresses and whale clusters so you are immediately notified if institutional cohorts change their distribution behavior.
- Conduct a Weekly Ledger Re-Check: On-chain dynamics move over weeks, not seconds. Schedule a recurring weekly audit to confirm whether your identified accumulation or distribution pattern remains intact.
Frequently Asked Questions
Do I need to know how to write code to conduct on-chain analysis?
No, you do not need programming skills to perform professional-grade on-chain analysis. Modern analytical platforms continuously index raw blockchain nodes, format smart contract calls, and present the resulting data through clear visual charts and interactive dashboards.
Can I apply on-chain analysis to traditional stocks like Apple or Tesla?
No, on-chain analysis is impossible in traditional stock markets. Centralized stock exchanges, traditional banks, and private brokerages operate on closed private databases; they do not publish a real-time, mathematically verifiable public ledger showing every customer deposit, withdrawal, and balance transfer.
Does a bullish on-chain signal mean the price will immediately rise?
No, on-chain metrics do not provide intraday execution timing. Ledger metrics reflect structural supply and demand fundamentals, operating like subterranean shifts that build pressure over time. A token showing heavy whale accumulation can remain flat or drift lower for weeks before the resulting supply crunch drives price upward.
ZenvestAI View
At ZenvestAI, our research shows that retail market participants who systematically track just two fundamental metrics—Exchange Netflows and the MVRV Ratio—consistently avoid panic-selling during standard market corrections.
To expand institutional-grade transparency for all investors, ZenvestAI research leverages a proprietary analytical framework: the Dormant Supply Velocity Index (DSVI).
Unlike standard coin-age models that inadvertently group commercial custodian cold storage reorganizations together with individual investor wallets, the DSVI algorithm programmatically isolates and excludes exchange-controlled reserve wallets. This granular filtering isolates authentic long-term retail and private family-office retention patterns, providing a cleaner signal of true market liquidity. We believe transparent, mathematically verifiable ledger analysis remains the single greatest competitive equalizer in modern financial history.
The Bottom Line
Price charts show where capital has already traded in the past; on-chain analysis reveals where capital is silently preparing to move next.
Related Intelligence
- How to Track Smart Money Wallet Clusters on Public Blockchains
- The Beginner’s Guide to Liquidity Pools and Real Protocol Yield
- Mastering the Bitcoin MVRV Ratio Across Macro Market Cycles
Regulatory Disclosure
Under global financial regulatory frameworks—including standards established by the International Organization of Securities Commissions (IOSCO), the U.S. Securities and Exchange Commission (SEC), and the European Union’s Markets in Crypto-Assets (MiCA) regulation—this article is published exclusively for educational and informational purposes. The analysis, metrics, and case studies presented herein do not constitute personalized investment, financial, tax, or legal advice. Digital assets demonstrate substantial market volatility and structural technological risks. Always conduct rigorous independent due diligence and consult a qualified, licensed financial professional before committing capital to cryptocurrency assets.
Data Sources
- Global Adoption and Stablecoin Volume: Chainalysis Research, 2026 Global Crypto Adoption Index, Chainalysis Adoption Index Report.
- Valuation and Transaction Foundations: Glassnode Documentation, Network Value to Transactions (NVT) Metric Architecture, Glassnode NVT Ratio Documentation.
- Cyclical Market Valuation Analysis: Glassnode Insights, Mastering the MVRV Ratio, Glassnode Research on MVRV.