The Federal Reserve balance sheet is a weekly financial statement showing what the U.S. central bank owns (assets) and what it owes or has issued (liabilities and capital).
At its core, the entire system runs on a double-entry balance:
When the Federal Reserve buys bonds, extends emergency credit, or conducts open-market operations, both the total size and the underlying composition of its balance sheet change. The resulting shifts in its liabilities—specifically commercial bank reserves—directly dictate funding costs across money markets, influence global dollar liquidity, and set the baseline risk appetite for risk-on assets like equities and crypto tracked across financial market structure and crypto markets.
As of the Federal Reserve H.4.1 statistical release (dated September 17, 2026), the Federal Reserve holds $6.75 trillion ($6,746,548 million) in total assets.
This marks a period of consolidation following the multi-year Quantitative Tightening (QT) campaign, which trimmed roughly $2.2 trillion from the all-time peak of $8.97 trillion recorded in April 2022.
The Federal Open Market Committee (FOMC) has transitioned from aggressive balance-sheet contraction into an ample reserves regime, managing structural liquidity through targeted short-term bill purchases known as Reserve Management Purchases (RMPs).
Federal Reserve Balance Sheet (September 2026)
| Core Component | Balance Sheet Side | Latest Value (Sept 2026) | Operational Role & Current Trend |
| U.S. Treasury Securities | Asset | $4,554 Billion | Backstop asset portfolio; growing modestly via short-term Treasury bill Reserve Management Purchases. |
| Agency Mortgage-Backed Securities (MBS) | Asset | $1,914 Billion | Housing debt runoff; shrinking continuously as principal paydowns roll over into Treasuries. |
| Bank Reserve Balances | Liability | $3,014 Billion | Operational cash commercial banks keep on deposit at the Fed, earning an Interest on Reserve Balances (IORB) rate of 3.90%. |
| Currency in Circulation | Liability | $2,485 Billion | Physical Federal Reserve notes held worldwide by individuals, merchants, and foreign institutions. |
| Treasury General Account (TGA) | Liability | $871 Billion | The U.S. Department of the Treasury’s primary checking account; fluctuates dynamically with quarterly taxes and debt issuance. |
| Overnight Reverse Repo (ON RRP) | Liability | ~$12 Billion | Excess cash absorption facility; usage has drained from over $2.5 trillion in 2022 to near zero, re-entering private capital markets. |
💡 ZenvestAI Quick Insight: Think of
the Federal Reserve as the world's master settlement bank. Its assets are the high-grade collateral (Treasury bonds and mortgage debt) it holds in custody.Its liabilities are the digital dollars (bank reserves) and paper bills (cash) it issues to commercial banks and the public. When the Fed expands its assets, it injects liquidity into the global economy; when it shrinks them, liquidity recedes.
Table of Contents
- What Is the Federal Reserve Balance Sheet, and How Does It Work?
- What Is the Federal Reserve Balance Sheet?
- How Does the Federal Reserve Balance Sheet Work?
- What Are the Fed’s Assets?
- What Are the Fed’s Liabilities?
- What Is the Treasury General Account (TGA)?
- How Does a Rising TGA Affect Bank Reserves?
- What Are Repo and Reverse Repo Transactions?
- What Is ON RRP?
- How Does the Fed Add or Remove Liquidity?
- What Is Quantitative Easing (QE)?
- What Is Quantitative Tightening (QT)?
- How Do Fed Balance-Sheet Changes Affect Liquidity?
- Why Does the Federal Reserve Balance Sheet Matter for Financial Markets?
- Fed Balance Sheet vs. Fed Net Liquidity
- A Simple Example of the Fed Balance Sheet in Action
- What Does the Federal Reserve Balance Sheet Look Like Today?
- How to Read the Federal Reserve H.4.1 Balance Sheet
- Federal Reserve Balance Sheet: Key Relationships to Remember
- Frequently Asked Questions
- ZenvestAI View
- Related Intelligence & Primary Sources
- Exclusive ZenvestAI Analytical Notes
- Regulatory Disclosure
- Author & Editorial Information
What Is the Federal Reserve Balance Sheet, and How Does It Work?
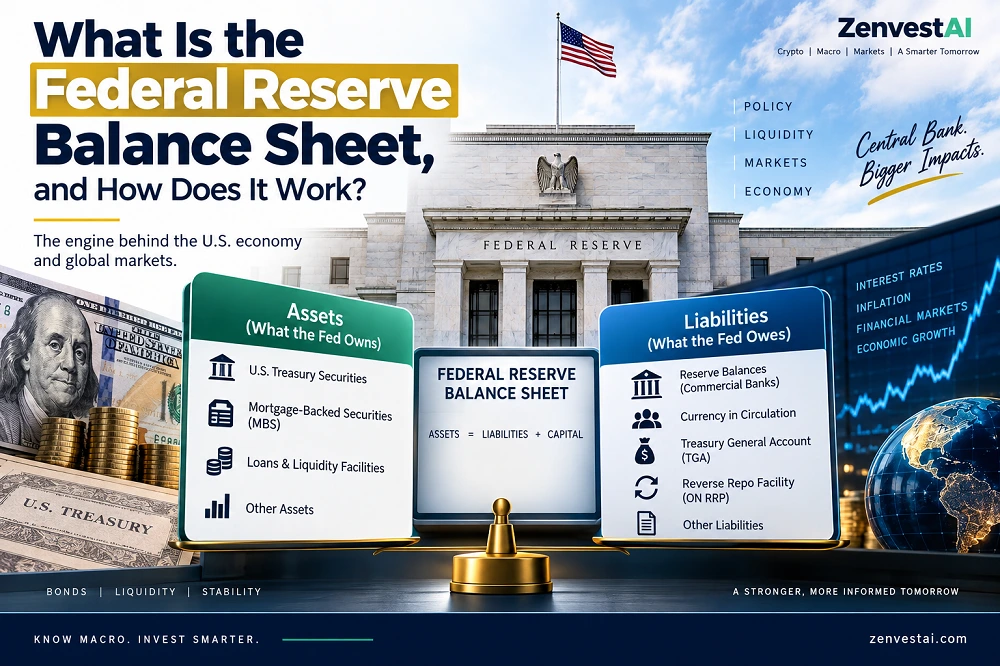
How did the central bank amass trillions of dollars of assets, and why do crypto traders and macro analysts track every move on this ledger? To understand that, let us examine the fundamental accounting identity behind it, a critical pillar of macro analysis outlined in our practical guide to 15 macro indicators for crypto research.
What Is the Federal Reserve Balance Sheet?
The Federal Reserve balance sheet operates under the classic accounting identity that governs any financial entity:
Assets = Liabilities + Capital
Unlike a private corporation that aims to turn a profit, the Federal Reserve manages its balance sheet exclusively to fulfill its statutory mandate from Congress: maximum employment, stable prices, and moderate long-term interest rates.
The Fed does not fund its purchases with investor equity. Instead, it pays for assets by creating central bank liabilities—primarily digital bank reserves.
Federal Reserve Balance Sheet Structure
A simplified breakdown of assets, operational backing, and liabilities
Assets
What the Fed Holds- U.S. Treasury Securities (Bills, Notes, Bonds)
- Agency Mortgage-Backed Securities (MBS)
- Discount Window & Liquidity Facility Loans
- Repurchase Agreements (Repo Assets)
- Foreign Currency & Gold Certificates
- Deferred Asset (Operational & remittance adjustments)
Liabilities & Capital
What the Fed Owes / Net Worth- Bank Reserve Balances (Deposits of depository institutions)
- Currency in Circulation (Federal Reserve notes)
- Treasury General Account (TGA) (U.S. government operating cash)
- Overnight Reverse Repurchase Agreements (ON RRP)
- Foreign Official & Other Deposits
- Member Bank Paid-in Capital & Surplus
The Crucial Distinction: Balance Sheet vs. Money Supply
A common misconception among beginner market participants is that the Fed’s balance sheet is identical to the circulating money supply. Equating the two leads to inaccurate investment conclusions.
For search precision and macro clarity, it is essential to distinguish between five closely related concepts:
- Fed Balance Sheet: The total book value of assets owned and liabilities owed by the twelve Federal Reserve Banks combined.
- Monetary Base M₀: The sum of physical currency in circulation plus total commercial bank reserves held at the Fed. This is the direct liability base created by the central bank.
- Bank Reserves: Digital deposits held by commercial banks (such as JPMorgan Chase, Bank of America, or Citibank) in their master accounts at regional Federal Reserve Banks. Reserves cannot circulate in the real economy; they exist only to settle transactions between banks and satisfy regulatory liquidity metrics.
- Broad Money Supply (M₂): The actual money circulating in the public economy, encompassing physical cash, retail checking deposits, savings accounts, and retail money-market funds. Commercial banks create M₂ through private credit expansion (commercial lending), not the Fed alone.
- Systemic Liquidity: The ease with which assets can be converted into immediately spendable cash or funding collateral without incurring punishing transaction costs or market discounts—a concept contrasting with decentralized on-chain models like automated liquidity pools and distributed ledger finance.
💡 ZenvestAI Quick Insight: The Fed creates high-powered money (reserves) on its balance sheet. Private commercial banks then use those reserves as a regulatory foundation to originate loans, create business deposits, and generate the consumer-facing money supply (M₂).
Now that we know what the balance sheet consists of, how do day-to-day transactions move these numbers? Let us break down the exact operational loop.
How Does the Federal Reserve Balance Sheet Work?
The Federal Reserve balance sheet functions as a continuous three-step clearinghouse mechanism.
Step 1: The Fed Owns Assets
The central bank holds interest-bearing securities and loan assets. In standard conditions, over 95% of these assets consist of U.S. Treasury securities and agency mortgage-backed securities (MBS) guaranteed by Fannie Mae, Freddie Mac, or Ginnie Mae.
Step 2: Those Assets Are Funded by Liabilities and Capital
Every dollar of assets acquired by the Fed must be matched by a corresponding dollar of liabilities or equity capital. The Fed issues three primary liabilities:
- Digital Reserve Balances: Issued directly to authorized commercial depository institutions.
- Federal Reserve Notes: Physical paper currency held by the public.
- The Treasury General Account (TGA): The operating cash balance maintained by the U.S. Department of the Treasury.
Step 3: Central Bank Transactions Reshape the Financial System
When the Federal Reserve executes monetary policy, it engages with private financial institutions (specifically designated primary dealers). These transactions mechanically alter the size or internal composition of the balance sheet:
- When the Fed Buys Assets (Expansion):
- The Fed buys $10 billion in Treasury bills from a primary dealer.
- The Fed adds the Treasury securities to its Asset ledger.
- The Fed pays the dealer’s clearing bank by crediting that bank’s master account with $10 billion in newly created Bank Reserves.
- Outcome: Fed assets increase by $10 billion, banking-system reserves expand by $10 billion, and overall financial liquidity rises.
- When the Fed Allows Assets to Mature (Runoff / Contraction):
- A $10 billion Treasury bond held by the Fed matures without being rolled over into a new issue.
- The U.S. Treasury pays the Fed to retire the debt, reducing its cash in the Treasury General Account (TGA).
- The Treasury replenishes its TGA cash by auctioning new debt to private banks and institutional investors.
- The private buyers transfer commercial bank deposits to the Treasury, draining equivalent bank reserves from the Fed’s balance sheet.
- Outcome: Fed assets decline by $10 billion, bank reserves fall, and the Fed’s total balance sheet contracts.
According to operational documentation published by the Federal Reserve Bank of New York, outright purchases and sales of securities represent permanent injections or subtractions of systemic reserves, whereas repurchase operations act as temporary liquidity dampeners.
What specific assets does the Fed accumulate during these cycles? Let us examine the asset side in detail.
What Are the Fed’s Assets?
The asset side represents everything of financial value held across the twelve regional Federal Reserve Banks.
U.S. Treasury Securities
U.S. Treasury securities form the structural foundation of the Fed’s asset portfolio. These holdings comprise:
- Treasury Bills (T-Bills): Short-term debt obligations maturing in one year or less.
- Treasury Notes: Intermediate sovereign paper maturing in two to ten years.
- Treasury Bonds: Long-term sovereign debt maturing in twenty to thirty years.
- TIPS (Treasury Inflation-Protected Securities): Notes and bonds indexed to the Consumer Price Index (CPI).
Holding Treasuries allows the central bank to influence benchmark risk-free yields across the global yield curve without introducing corporate credit default risk into the national monetary authority.
Agency Mortgage-Backed Securities
Agency Mortgage-Backed Securities (MBS) are pools of residential and commercial mortgages packaged and guaranteed by government-sponsored enterprises (GSEs) such as Fannie Mae and Freddie Mac.
The Fed introduced MBS purchases during the 2008 Global Financial Crisis to repair the broken mortgage market and suppress retail home mortgage rates.
Over the current 2025–2026 cycle, the Fed has allowed these securities to roll off predictably without active selling, returning toward an all-Treasury asset profile.
Repurchase Agreements and Lending Facilities
During financial dislocations, the Fed provides collateralized emergency liquidity:
Repo Operations: The Fed buys securities from primary dealers under an agreement to resell them at a future date, acting as a temporary collateralized cash loan.
The Discount Window: The Fed’s traditional emergency lending portal, where commercial banks pledge approved collateral to borrow reserves overnight.
Emergency Credit Facilities: Targeted facilities (such as the historical Term Asset-Backed Securities Loan Facility or Bank Term Funding Program) established under Section 13(3) of the Federal Reserve Act to alleviate specific credit bottlenecks—operating on high-grade collateral principles similar to those analyzed in our study of collateral as the foundation of modern financing.
Other Assets
The remainder of the asset column includes specialized accounting balances:
- Gold Certificate Account: Representing statutory claims against the U.S. Treasury’s official gold stock, maintained at a statutory valuation of $42.22 per fine troy ounce.
- Foreign-Currency Assets: Denominated in euros, Japanese yen, and other major currencies to facilitate foreign-exchange intervention or bilateral swap lines.
- Central Bank Liquidity Swap Lines: Facilities that supply U.S. dollars to major foreign central banks (such as the ECB, Bank of England, Bank of Japan, and Swiss National Bank) against their native currency collateral during offshore dollar funding crunches.
- Deferred Asset: An accounting asset that tracks cumulative operating losses when the Fed’s payout on bank reserves exceeds its portfolio yield earnings.
Asset Holdings
Est. September 2026If assets show where the Fed has deployed its financial power, liabilities show where that liquidity currently sits. Let us review the liability side.
What Are the Fed’s Liabilities?
Every asset on the Fed’s balance sheet is supported by a corresponding liability owed to private institutions, the government, or the public.
Bank Reserve Balances
Bank reserves are digital funds maintained by commercial banks in statutory accounts at the Federal Reserve. They represent an asset for the commercial bank and a direct liability of the Fed.
Under modern monetary framework rules, reserves exist in an “ample” capacity, meaning banks hold enough reserves to meet regulatory liquidity requirements (such as the Liquidity Coverage Ratio) and clear intra-day interbank obligations without borrowing from peers at penalty rates.
Federal Reserve Notes
Federal Reserve notes represent physical paper currency circulating around the globe. When commercial banks experience heavy customer cash withdrawals, they convert a portion of their electronic reserve balances into physical notes. Physical cash demand is determined entirely by public preference and seasonal commerce, not direct FOMC policy targets.
Treasury General Account (TGA)
The Treasury General Account is the primary operational checking balance of the U.S. Department of the Treasury. Just as a household uses a checking account to collect income and pay bills, the U.S. government uses the TGA to receive tax receipts, deposit borrowing proceeds, pay military and federal contractor salaries, and issue Social Security benefits.
Reverse Repurchase Agreements (RRP)
In a reverse repo, an approved counterparty (such as a money-market fund, government-sponsored enterprise, or primary dealer) lends cash to the Federal Reserve in exchange for high-quality Treasury collateral overnight. This absorbs cash out of short-term money markets, preventing short-term rates from trading below the Fed’s target floor.
Other Liabilities and Capital
- Foreign Official Deposits: Balances held by foreign central banks and international agencies at the New York Fed.
- Designated Financial Market Utility (DFMU) Deposits: Settlement balances maintained by systemically important clearinghouses.
- Capital Paid-In: Statutory stock purchased by member commercial banks, supplemented by retained earnings surplus accounts.
Because movements in the Treasury General Account directly alter commercial bank reserves dollar for dollar, the TGA deserves dedicated focus.
What Is the Treasury General Account (TGA)?
The Treasury General Account (TGA) is the checking account of the U.S. Federal Government, housed directly at the Federal Reserve Bank of New York.
The TGA Liquidity Cycle
The Treasury does not manage monetary policy; it manages fiscal solvency. However, because the TGA resides on the liability side of the central bank’s balance sheet alongside commercial bank reserves, every fluctuation in the TGA directly impacts the quantity of reserves available to the commercial banking system.
💡 In Simple Terms: Think of the Fed’s total liability ledger as a fixed pie. If the Fed’s total assets do not change, any increase in the Treasury’s checking balance must be subtracted directly from the commercial banks’ reserve balance.
How does this mechanical trade-off occur in the real world? Let us examine the reserve drain mechanism.
How Does a Rising TGA Affect Bank Reserves?
When the U.S. Treasury builds cash in its checking account, it drains liquidity from private markets. When it spends that cash down, it flushes liquidity back into commercial circulation.
Mechanism 1: The TGA Increases (Reserve Drain)
When corporations and citizens pay their quarterly taxes, or when institutional investors purchase newly issued Treasury bills:
$$\text{Taxpayers / Investors Transfer Bank Deposits} \longrightarrow \text{Treasury Account at Fed (TGA)}$$
- Private citizens and funds transfer cash from their commercial checking accounts to the federal government.
- The commercial banks must settle this tax transfer by transferring digital reserves from their accounts at the Fed into the TGA.
- The Result: TGA liabilities increase. Assuming the Fed’s total asset size is static, bank reserves decline dollar for dollar. Private interbank liquidity contracts.
Mechanism 2: The TGA Decreases (Reserve Injection)
When the federal government executes budget outlays—disbursing military paychecks, Medicare claims, or highway construction funding:
Treasury Spends Cash From TGA → Recipients Deposit Checks in Commercial Banks- The federal government sends funds out of the TGA to private individuals and corporate contractors.
- The recipients deposit these payments into their retail accounts at commercial banks.
- The Fed settles the transaction by reducing the balance in the TGA and crediting the commercial banks with fresh bank reserves.
- The Result: TGA liabilities fall. Bank reserves expand dollar for dollar. Systemic money-market liquidity increases.
Crucial Analytical Nuance: Fiscal Flow vs. Monetary Policy
A surging or plunging TGA balance does not indicate a deliberate shift in FOMC monetary policy. TGA fluctuations represent sovereign fiscal logistics—such as seasonal tax deadlines in April and September or sovereign debt debt-ceiling resolutions.
Yet, for crypto traders monitoring systemic risk watch indicators and macro risk managers, a rapid build-up in the TGA feels functionally identical to Quantitative Tightening because it removes cash from commercial bank reserves.
Along with the TGA, open-market repurchase operations provide the Fed with fine-tuned, daily control over system liquidity.
What Are Repo and Reverse Repo Transactions?
Repurchase agreements (repos) and reverse repurchase agreements (reverse repos) are temporary, collateralized liquidity adjustments conducted by the Open Market Trading Desk at the Federal Reserve Bank of New York.
Repo vs. Reverse Repo at a Glance
| Transaction | Operational Mechanics | Economic Equivalency | Effect on Bank Reserves | Primary Policy Purpose |
| Fed Repo | The Fed buys securities from dealers and sells them back later. | The Fed lends cash against pristine Treasury collateral. | Temporarily Increases Reserves | Injects liquidity when short-term cash markets seize up or face stress. |
| Fed Reverse Repo | The Fed sells securities to dealers and buys them back later. | The Fed borrows cash against its Treasury collateral. | Temporarily Decreases Reserves | Soaks up excess cash to prevent short-term rates from falling below target. |
As highlighted in Federal Reserve Bank of New York educational documentation, a repo operation is economically identical to an asset-backed collateralized loan. It serves as a relief valve when cash is scarce, while reverse repos lock away idle liquidity when money markets are overflowing with cash.
The most widely scrutinized version of this operation is the overnight reverse repo program.
What Is ON RRP?
The Overnight Reverse Repurchase Agreement Facility (ON RRP) is a monetary policy buffer operated by the Federal Reserve. It allows approved non-bank institutions—specifically money-market mutual funds (MMFs) and government-sponsored enterprises (GSEs)—to park cash overnight with the Federal Reserve in exchange for high-grade Treasury securities and an explicit rate of interest (the ON RRP offering rate).
The ON RRP Cash Absorption Loop
Why the ON RRP Facility Was Built
Traditional commercial banks can earn the Interest on Reserve Balances (IORB) rate directly on their deposits at the Fed. However, non-bank financial giants like money-market funds manage trillions in retail savings and treasury cash, but are legally prohibited from holding reserve balances at the central bank.
Without the ON RRP facility, these cash funds would flood private repo markets, driving short-term Treasury bill yields and collateralized repo rates below the Fed’s target range. The ON RRP facility forms the unshakeable floor under the federal funds target rate.
Reserves vs. ON RRP: Why the Difference Matters
Treating ON RRP balances as equivalent to commercial bank reserves is a structural mistake:
Bank reserves are held by depository institutions. They directly back commercial lending capacity, fulfill corporate liquidity mandates, and empower investment banking trading desks to provide liquidity to equity, fixed income, and digital asset markets.
ON RRP funds are parked by conservative asset managers seeking zero-risk overnight yield. When cash is trapped in the ON RRP, it sits dormant, contributing nothing to active market risk-taking.
Between 2021 and 2023, the ON RRP facility surged past $2.5 trillion due to massive pandemic-era stimulus. Over the 2024–2026 cycle, that mountain of cash steadily drained back into the private sector as attractive short-term Treasury yields incentivized money funds to buy sovereign bills instead. By late 2026, ON RRP usage sits near zero, demonstrating that excess liquidity has been reabsorbed by the real economy.
Understanding how reserves, the TGA, and the ON RRP interact explains how the Fed adds or drains liquidity across the financial system.
How Does the Fed Add or Remove Liquidity?
The Federal Reserve adjusts systemic liquidity through two operational channels: asset-side operations and liability-side shifts.
Liquidity Control Architecture
- Outright QE: Bond Purchases
- Quantitative Tightening (QT): Balance sheet runoff
- Reserve Management: Short-term bills
- Repos: Overnight & Term Repos
- ON RRP Operations: Floor maintenance
- Discount Window: Emergency lending facility
Ways Systemic Liquidity Can Increase
Systemic liquidity expands whenever commercial bank reserves rise, giving the banking sector greater balance-sheet capacity:
- Outright Asset Purchases: When the Fed buys Treasuries or MBS directly from the market, it credits dealer banks with new reserves.
- Repurchase Operations (Repos): The Fed temporarily injects emergency cash against collateral to smooth over quarter-end repo spikes.
- Discount Window and Emergency Facility Lending: When banks draw on central bank lending windows, the Fed creates reserves against pledged collateral.
- Drawing Down the TGA: As the Treasury spends down its federal cash, funds leave the government’s account and flood into commercial bank reserves.
- Draining the ON RRP: As money-market funds pull cash out of the Fed facility to purchase private debt or Treasury bills, that cash re-enters the commercial banking system.
Ways Systemic Liquidity Can Decrease
Systemic liquidity contracts whenever bank reserves are pulled out of the private sector:
- Portfolio Runoff (Quantitative Tightening): Maturing bonds are retired without reinvestment, extracting cash reserves from commercial buyers.
- Active Asset Sales: The Fed sells bonds directly into the secondary market, soaking up buyer reserves.
- Expanding the Treasury General Account (TGA): High tax payments or aggressive Treasury debt issuance transfer private deposits into the government’s central account, draining bank reserves.
- Surging ON RRP Usage: When short-term money funds move cash out of commercial banks and into the Fed’s overnight facility, that money is removed from active capital markets.
- Repaying Central Bank Loans: As emergency lending programs expire and banks repay their borrowing, the repaid reserves are extinguished.
The largest and most systemic iterations of these operations are known worldwide as Quantitative Easing and Quantitative Tightening.
What Is Quantitative Easing (QE)?
Quantitative Easing (QE) is an unconventional monetary policy where a central bank purchases large quantities of long-term sovereign bonds and mortgage debt from private markets to lower long-term interest rates and stimulate economic activity.
The Quantitative Easing Cycle
Why QE Is Not Simply “Printing Money”
In casual financial commentary, QE is routinely dismissed as simple “money printing.” From an accounting and institutional perspective, this description is misleading:
- The Federal Reserve does not physically run printing presses to fund quantitative easing, nor does it deposit money directly into retail bank accounts.
- QE is an asset exchange. The Fed removes a fixed-income bond (an interest-earning asset) from the private sector and replaces it with an equivalent value of bank reserves (an interest-earning cash deposit).
- No newly manufactured currency enters the broad money supply (M₂) unless commercial banks use their expanded reserve capacity to extend new loans to retail consumers and businesses.
QE does, however, depress long-term bond yields, reduce borrowing costs for mortgages and corporate debt, and incentivize investors to rotate out of low-yielding sovereign debt into higher-returning assets like corporate credit, tech equities, and digital assets explored in our overview of crypto basics and the fundamentals of blockchain technology.
What happens when the central bank decides the economy is overheating? It reverses the process through Quantitative Tightening.
What Is Quantitative Tightening (QT)?
Quantitative Tightening (QT) is the systematic process of shrinking the Federal Reserve’s balance sheet by unwinding the assets accumulated during periods of Quantitative Easing.
The Quantitative Tightening Cycle
During QT, the central bank establishes monthly “redemption caps.” If maturing bonds exceed the cap, the excess is reinvested in new debt; the rest matures and leaves the balance sheet without replacement.
The Critical Non-Linearity: Shrinking Assets ≠ Instant Financial Tightening
A critical mistake made by quantitative models is assuming that every dollar stripped from the Fed’s asset ledger automatically tightens broader financial conditions by an identical ratio.
The real-world market impact depends entirely on which liability absorbs the decline:
Scenario A (Benign Contraction): If QT coincides with a drain from the ON RRP facility, idle money-market cash steps up to purchase the Treasury’s replacement debt. In this case, bank reserves remain completely untouched, and broader market liquidity stays stable. This exact dynamic shielded equity and crypto markets from severe liquidity shortages throughout 2023 and early 2024.
Scenario B (Acute Contraction): Once the ON RRP facility is empty (as is the case in late 2026), every further reduction in Fed assets must come directly out of commercial bank reserves. This directly reduces interbank liquidity, widens money-market spreads, and tightens credit conditions across the economy.
Recent Federal Reserve research emphasizes that as reserves approach the “lowest comfortable level” (LCLOR), balance-sheet reduction must slow down or halt to avoid sudden repo market spikes, similar to the funding crunch of September 2019.
This brings us to the core transmission mechanism: how balance-sheet adjustments move capital markets.
How Do Fed Balance-Sheet Changes Affect Liquidity?
The relationship between the Federal Reserve balance sheet and the financial economy is mechanical first, economic second.
Liquidity Transmission Map
Repo Rates, SOFR, Commercial Paper
Treasuries, Corporate Bonds, Equities, VC, Crypto
The Transmission Mechanism: Step by Step
- The Core Liquidity Well: The Fed alters reserve supply via asset purchases, runoff, or facility operations.
- Short-Term Money Markets: Fluctuations in reserves alter the Secured Overnight Financing Rate (SOFR) and private repo funding rates. When reserves are abundant, repo rates stay anchored at or slightly below the Fed’s IORB rate. When reserves are scarce, borrowers bid up overnight rates.
- Primary Dealer Inventory Capacity: Primary dealers use overnight repo borrowing to finance their inventories of government bonds. If their funding costs spike or reserve cash dries up, their ability to make markets in Treasuries, corporate credit, and structured products declines.
- Capital Market Pricing: When bond dealers pull back and funding spreads widen, risk premia ripple outward into corporate credit spreads, equity valuations, and speculative digital assets—directly influencing active strategies in crypto futures trading and margin trading.
📈 What This Means for Markets: Liquidity does not leap directly from the Fed’s balance sheet into Bitcoin or the S&P 500. It travels through the piping of short-term money markets, sovereign debt primary dealers, and commercial bank balance-sheet constraints. When the pipes are full, risk-taking thrives. When the pipes run dry, capital contracts.
With the mechanics established, let us evaluate the practical question: why does this matter for bonds, equities, and cryptocurrency?
Why Does the Federal Reserve Balance Sheet Matter for Financial Markets?
Treasury and Bond Markets
The Federal Reserve remains the single largest systemic holder of U.S. government debt. When the Fed actively purchases Treasuries, it acts as an insensitive, price-inelastic buyer, compressing term premia (the extra yield investors demand to hold long-term debt). When the Fed steps away during QT, private investors must absorb trillions in sovereign supply, forcing yields higher and steepening the yield curve.
Money Markets
The overnight Treasury repo market represents the primary transmission channel between the Fed’s balance-sheet operations and the real economy. If aggregate bank reserves drop below structural thresholds, overnight funding rates trade volatilely, forcing leveraged funds to unwind bond-basis trades and reduce asset holdings.
Equities
A growing balance sheet lowers the risk-free discount rate, boosting the present value of future corporate cash flows. This benefits long-duration growth stocks, such as technology, software, and artificial intelligence enterprises.
Conversely, balance-sheet contraction raises funding hurdles and curbs corporate leverage. However, simple historical heuristics like “Fed balance sheet up = stocks must go up” often fail when corporate earnings growth outpaces monetary drag.
Crypto Markets (The ZenvestAI Lens)
For digital asset investors, the Federal Reserve balance sheet is a critical macro indicator.
Cryptocurrencies—particularly Bitcoin (BTC) and major digital assets—trade as hyper-sensitive gauges of global fiat liquidity. Because Bitcoin was invented as a hard-money architecture with a strictly capped supply and no sovereign cash flows to discount, its price reflects real-time changes in the purchasing power and supply of fiat credit—a dynamic thoroughly tracked in our Bitcoin price action and trend analysis and our complete Bitcoin wealth strategy.
Crypto & Macro Liquidity Relationship
Crypto researchers actively monitor:
- The Net Expansion or Contraction of Commercial Bank Reserves: When reserves expand, institutional capital moves out along the risk curve into alternative asset classes like smart contract networks detailed in our Ethereum wealth strategy.
- Stablecoin Reserve Compositions: Major fiat-backed assets—covered in our guide on what a stablecoin is and how stablecoins work—such as Tether’s USDT and Circle’s USDC, invest their backing reserves almost entirely in short-term U.S. Treasury bills and reverse repos. The yields set by the Fed directly determine the revenue model of the stablecoin ecosystem.
- Cross-Currency Dollar Demand: During offshore dollar shortages, capital rushes back into cash and Treasury bills, prompting rapid sell-offs across spot crypto trading markets and decentralized finance (DeFi) protocols.
Analytical Qualification: While Bitcoin exhibits strong historical correlation with broad dollar liquidity cycles, it is not a direct mathematical function of the Fed’s ledger. Structural adoption milestones—such as Spot Bitcoin ETFs, nation-state reserve allocations, and evolving global frameworks like Europe’s MiCA regulation—can drive independent market cycles regardless of central bank balance-sheet trends.
To track these market dynamics accurately, analysts turn to a critical formula: Fed Net Liquidity.
Fed Balance Sheet vs. Fed Net Liquidity
Looking exclusively at the headline size of the Fed’s balance sheet can be deceptive. A rising headline asset number does not necessarily translate into more capital flowing through financial markets.
For this reason, macro analysts, institutional hedge funds, and digital asset researchers use an analytical proxy known as Fed Net Liquidity.
The Analytical Formula
Fed Net Liquidity ≈ Total Fed Assets − Treasury General Account (TGA) − Overnight Reverse Repo (ON RRP)Fed Net Liquidity Composition
Why This Distinction Matters
- Total Assets show the gross size of the central bank’s holdings.
- The TGA holds money set aside for government spending, meaning that cash is locked away from the private banking system.
- The ON RRP holds money parked by money-market funds, meaning that cash is not circulating through private investment channels.
Subtracting both the TGA and the ON RRP from total assets leaves the net amount of usable liquidity supporting the commercial banking system.
Important Disclosure: Fed Net Liquidity is an analytical convention developed by financial analysts and researchers. It is not an official statutory metric published by the Federal Reserve Board. Nevertheless, it tracks equity and crypto drawdowns more closely than the headline balance sheet alone, as monitored by the ZenvestAI Research Desk.
To see these mechanics in action, let us review a simple numerical scenario.
A Simple Example of the Fed Balance Sheet in Action
To understand the difference between asset purchases and liability shifts, compare two distinct $100 billion transactions side by side.
Scenario A: The Fed Buys $100 Billion of Treasury Bonds
Initial State: Fed Assets = $7.00T | Fed Liabilities = $7.00T
- The Fed purchases $100 billion in Treasury notes from primary dealers.
- The Fed adds the notes to its balance sheet (Assets +$100B).
- The Fed pays the dealers’ commercial banks by crediting them with newly created reserves (Reserves +$100B).
$100B Fed Asset Purchase: Balance Sheet Expansion
Scenario B: The Treasury Raises $100 Billion in Cash (TGA Surges)
Initial State: Fed Assets = $7.10T | Fed Liabilities = $7.10T
Now, consider what happens when the Fed takes no action, but the U.S. Treasury collects $100 billion in quarterly taxes:
- Taxpayers send $100 billion from their commercial accounts to the federal government.
- The Fed shifts $100 billion within its own liabilities from commercial bank reserves to the TGA.
- Outcome: Assets remain unchanged at $7.10T. Total liabilities remain unchanged at $7.10T. However, commercial bank reserves plunge by $100 billion, while the TGA rises by $100 billion.
Liability-Side Composition Shift
This contrast illustrates why headline balance sheet stability can mask underlying contractions in commercial bank liquidity.
What does the real-world Federal Reserve balance sheet look like today? Let us inspect the latest public data.
What Does the Federal Reserve Balance Sheet Look Like Today?
According to the official Federal Reserve H.4.1 statistical release published on September 17, 2026, total assets across the Federal Reserve system stand at $6.75 trillion ($6,746,548 million).
Historical Asset Trajectory (2020 – 2026)
Three Major Structural Developments Defining the 2026 Ledger
1. Transition to Active Reserve Management
The multi-year phase of aggressive Quantitative Tightening (QT)—which trimmed approximately $2.2 trillion from the balance sheet following the pandemic peak—has concluded its rapid runoff phase, setting the baseline for crypto trends in 2026.
To prevent an acute reserve shortage in interbank markets, the FOMC has stabilized the overall balance sheet around the $6.75 trillion mark. The Fed has introduced targeted Reserve Management Purchases (RMPs), buying short-term Treasury bills to accommodate ongoing economic growth and currency demand without triggering unwanted spikes in overnight funding rates.
2. Negative Net Income and the “Deferred Asset”
Because interest rates remain elevated across global markets—with the target federal funds rate set at 3.75% to 4.00% in late 2026—the Fed’s interest expenses exceed its investment income. The central bank pays an Interest on Reserve Balances (IORB) rate of 3.90% to commercial banks on over $3.0 trillion in deposits, alongside interest on remaining reverse repos.
However, the bulk of the Fed’s asset portfolio consists of older Treasury bonds and agency MBS purchased during the low-rate environment of 2020–2021, which yield an average of only 2.0% to 2.5%.
This yield mismatch generates an ongoing operational deficit. Under statutory rules, the Fed does not declare bankruptcy or impair its capital accounts; instead, it records this negative net income as a deferred asset under its other asset liabilities. This accounting convention does not hinder its day-to-day operational ability to conduct monetary policy or clear payments.
3. Depleted ON RRP Usage
Usage of the Overnight Reverse Repurchase Agreement (ON RRP) facility, which surpassed $2.5 trillion during the peak of pandemic stimulus, has dropped to near zero (~$12 billion).
With excess cash fully absorbed back into traditional bank deposits and short-term Treasury bills, commercial bank reserves now absorb the full impact of any future Treasury cash management or open-market operations.
To monitor these dynamics on an ongoing basis, how can you read the primary source document yourself?
How to Read the Federal Reserve H.4.1 Balance Sheet
The Federal Reserve publishes its official balance sheet every Thursday afternoon at 4:30 PM Eastern Time in the H.4.1 statistical release, titled “Factors Affecting Reserve Balances of Depository Institutions and Condition Statement of Federal Reserve Banks”.
When reviewing the official report, focus on the following primary tables:
How to Navigate the H.4.1 Report
Measures systemic liquidity additions and subtractions across the banking sector.
The formal double-entry accounting ledger of all 12 Federal Reserve Banks.
Key Line Items to Check Every Week
- Total Assets (Line 1 / Table 1): Shows whether the overall balance sheet expanded or contracted over the past reporting week.
- U.S. Treasury Securities: Check whether changes are concentrated in short-term Treasury bills (reserve management) or longer-term coupon bonds.
- Agency Mortgage-Backed Securities: Tracks the continuing structural runoff of residential mortgage pools.
- Reserve Balances with Federal Reserve Banks: The single most critical line item for financial liquidity. Look for trends where reserves drift below comfortable operating levels (historically 10% to 12% of total nominal U.S. GDP).
- U.S. Treasury, General Account (TGA): Check if the federal government is rebuilding its cash balance (a liquidity drain) or spending it down (a liquidity injection), tracked daily via official Daily Treasury Statement filings.
- Reverse Repurchase Agreements – Others (ON RRP): Highlights whether cash is being drawn into the Fed’s overnight facility or deployed into private markets.
Here is a quick summary table covering every major balance-sheet relationship.
Federal Reserve Balance Sheet: Key Relationships to Remember
| Central Bank Operation / Event | Impact on Fed Assets | Impact on Commercial Reserves | Impact on Broader Liquidity |
| Fed Buys Securities (QE / RMP) | Assets Increase | Reserves Increase | Expands Liquidity |
| Fed Sells Securities | Assets Decrease | Reserves Decrease | Contracts Liquidity |
| Bonds Mature Unreplaced (QT) | Assets Decrease | Reserves Decrease | Contracts Liquidity |
| Treasury General Account (TGA) Rises | Unchanged | Reserves Decrease | Contracts Liquidity |
| Treasury General Account (TGA) Falls | Unchanged | Reserves Increase | Expands Liquidity |
| Federal Reserve Repo Operation | Assets Temporarily Rise | Reserves Temporarily Rise | Temporarily Adds Liquidity |
| Federal Reserve Reverse Repo | Unchanged | Reserves Temporarily Fall | Temporarily Drains Liquidity |
| ON RRP Facility Balance Rises | Unchanged | Reserves Decrease | Absorbs Idle Cash |
| ON RRP Facility Balance Falls | Unchanged | Reserves Increase | Releases Cash to Private Markets |
Operational Note: Actual reserve balances are determined by the simultaneous interplay of all these factors. An asset purchase by the Fed can be temporarily offset if the U.S. Treasury expands the TGA by an equivalent amount during the same week.
Let us answer the most frequent questions investors and analysts ask about the balance sheet.
Frequently Asked Questions
What is the Federal Reserve balance sheet?
The Federal Reserve balance sheet is a formal financial statement published weekly that details the assets owned by the U.S. central bank (primarily government bonds and mortgage securities) and the liabilities it owes (primarily commercial bank reserves, physical paper cash, and the U.S. Treasury’s operating account).
What are the largest assets on the Fed’s balance sheet?
U.S. Treasury securities and agency mortgage-backed securities (MBS) make up over 95% of the Fed’s assets. As of late 2026, the Fed holds approximately $4.55 trillion in Treasuries and $1.91 trillion in agency MBS.
What are the largest Fed liabilities?
The two largest liabilities are commercial bank reserve balances (deposits commercial banks hold at the central bank) and Federal Reserve notes (physical paper currency circulating globally). Together, these comprise the vast majority of the Fed’s liability base.
Are bank reserves an asset or a liability?
Bank reserves are both, depending on whose accounting ledger you are inspecting. To the private commercial banking system, reserves are an asset (cash deposits). To the Federal Reserve, reserves are a liability (a promise to settle obligations for the banking sector).
What is the Treasury General Account (TGA)?
The Treasury General Account is the primary operational checking account of the U.S. Department of the Treasury, held at the Federal Reserve Bank of New York. The federal government uses this account to collect tax revenues, deposit debt issuance proceeds, and pay federal obligations.
Does a higher TGA reduce bank reserves?
Yes. When citizens, companies, and institutional funds pay taxes or purchase newly issued government bonds, funds leave commercial bank accounts and are transferred into the TGA. This draws down commercial bank reserves dollar for dollar, reducing interbank liquidity.
What is ON RRP?
The Overnight Reverse Repurchase Agreement Facility (ON RRP) is a monetary policy tool that allows non-bank institutional lenders (such as money-market funds and government-sponsored enterprises) to park cash overnight with the Federal Reserve in exchange for high-grade collateral and a set rate of interest.
What is the difference between a repo and a reverse repo?
In a repo, the Fed lends cash against securities collateral, temporarily injecting reserves into the banking system. In a reverse repo, the Fed receives cash from counterparties against collateral, temporarily removing reserves from the system.
Does Quantitative Easing (QE) increase the Fed balance sheet?
Yes. During QE, the Fed purchases long-term bonds from the open market and creates new bank reserves to pay for them, expanding both its assets and its liabilities.
Does Quantitative Tightening (QT) reduce the Fed balance sheet?
Yes. During QT, the Fed allows a portion of its maturing bonds to roll off without reinvestment. As the Treasury retires this debt, central bank assets fall, and commercial bank reserves contract.
Does a larger Fed balance sheet always mean more liquidity?
Not necessarily. While a larger asset base generally increases systemic capacity, the composition of the liability ledger matters just as much. If total assets expand but the newly created funds sit idle in the Treasury General Account or the ON RRP facility, working liquidity within the commercial banking system remains flat.
Is the Fed balance sheet the same as the money supply?
No. The Fed’s balance sheet represents central bank assets and high-powered money ($M_0$), whereas the common money supply ($M_2$) consists of retail deposits and cash held by the non-bank public. Commercial banks create broad money supply through private lending, using their central bank reserves as an interbank settlement foundation.
Why does the Fed balance sheet matter for crypto markets?
Bitcoin and major digital assets trade as real-time barometers of global fiat liquidity. When the Fed’s balance sheet expands and bank reserves increase, dollar borrowing costs soften, encouraging investors to rotate capital out along the risk curve into digital assets. When the balance sheet contracts and bank reserves decline, liquidity tightens, often triggering risk-off corrections across crypto markets—a relationship fundamental to the Token Economic Resilience Framework.
ZenvestAI View
At ZenvestAI, our core perspective is that modern financial markets cannot be analyzed through equity earnings or technical chart patterns in isolation. Sovereign debt markets, commercial bank balance sheets, and cryptocurrency valuations are all interconnected parts of an international financial system anchored to the Federal Reserve’s ledger.
Crypto investors who track the Federal Reserve balance sheet should avoid two common analytical pitfalls:
- The “Infinite Money Printing” Myth: Viewing every balance-sheet expansion as uninhibited inflation overlooks the mechanics of asset swaps, bank reserve constraints, and institutional debt dynamics—as detailed in our research on tokenization and wholesale digital assets in 2026.
- The “Headline Figure” Trap: Monitoring only gross headline assets without subtracting the TGA and ON RRP ignores where capital actually resides.
By monitoring the structural flows between the Fed’s assets, commercial reserves, and Treasury cash management, market participants can spot systemic liquidity shifts well before they appear in headline retail indicators.
The Bottom Line On What Is the Federal Reserve Balance Sheet, and How Does It Work?
The Federal Reserve balance sheet is not an abstract economic theory; it is the fundamental double-entry settlement engine of global finance. Its expansion creates the reserves that power commercial credit, sovereign bond stability, and risk-on asset classes—including crypto—while its contraction tightens liquidity across the financial system.
Related Intelligence & Primary Sources
To inspect and verify official central bank data directly from primary regulatory sources, consult the following public repositories:
- Federal Reserve H.4.1 Release — The official weekly statistical release detailing balance-sheet factors and Reserve Bank conditions.
- Federal Reserve Bank of New York: Open Market Operations — Technical documentation on repo, reverse repo, and secondary market execution.
- U.S. Department of the Treasury: Daily Treasury Statement — Daily public reporting on federal tax receipts, spending flows, and the closing cash balance of the Treasury General Account (TGA).
- Federal Reserve Board: Financial Accounts of the United States (Z.1) — Quarterly flow-of-funds data mapping sector-by-sector balance sheets across the U.S. economy.
Exclusive ZenvestAI Analytical Notes
Here are three structural realities of the Federal Reserve balance sheet that are rarely discussed on retail financial websites, yet drive institutional capital positioning:
1. The Stablecoin “Shadow Reserve” Dynamic
The largest dollar stablecoins (Tether USDT and Circle USDC) manage over $200 billion in short-term liquidity, backed predominantly by U.S. Treasury bills and overnight repo assets.
Because stablecoin issuers maintain these reserves with primary dealers and custody institutions, the global crypto market has effectively built a private settlement bridge directly into the short-term funding markets governed by the Fed’s balance-sheet policies.
When the Fed holds short-term interest rates high, stablecoin treasuries earn billions in annual sovereign yield, transforming the economics of decentralized finance, native crypto staking, and decentralized on-chain yield.
2. The Mechanics of the “Deferred Asset”
Retail commentators frequently claim that operational losses could force the Federal Reserve to seek a federal bailout. In reality, the Fed’s accounting framework bypasses this entirely:
$$\text{Net Operating Loss} \longrightarrow \text{Cumulative Deferred Asset}$$
Under the Fed’s accounting rules, operational losses are recorded as a deferred asset—representing future earnings the Fed must retain before resuming statutory remittances to the U.S. Treasury.
Because the central bank creates its own settlement currency, it operates without conventional equity solvency constraints. Its balance sheet is constrained by statutory mandates and inflation targets, not corporate bankruptcy rules.
3. The 10% Reserve-to-GDP Floor
Institutional stress indicators suggest that when aggregate bank reserves fall below approximately 10% to 11% of nominal U.S. GDP, interbank settlement frictions begin to emerge.
As U.S. nominal GDP expands toward $30 trillion, the minimal viable level of commercial bank reserves shifts upward toward $3.0 trillion. This economic reality explains why the Federal Reserve stabilized its balance-sheet runoff around $6.75 trillion in 2026 and introduced ongoing Treasury bill Reserve Management Purchases (RMPs) to sustain the ample reserves regime.
Regulatory Disclosure
This article is published strictly for educational and informational purposes by ZenvestAI. In compliance with international regulatory guidelines—including standards outlined by the International Organization of Securities Commissions (IOSCO), the U.S. Securities and Exchange Commission (SEC), and the European Union’s Markets in Crypto-Assets (MiCA) regulation—the contents herein do not constitute financial, investment, legal, tax, or trading advice. For details on regional jurisdictional standards, refer to our global coverage on USA crypto regulation and India crypto regulation.
Digital assets, stablecoins, and fixed-income securities involve substantial risk of financial loss. Past performance of macroeconomic indicators, central bank policies, or digital asset valuations does not guarantee future results. Readers must conduct independent due diligence and consult certified financial advisors before executing any investment transactions. For further terms, review our disclaimer and privacy policy.
Author & Editorial Information
- Publisher: ZenvestAI Research Desk — zenvestai.com (See our Editorial Policy)
- Editorial Focus: Federal Reserve Mechanics, Central Bank Balance Sheets, Dollar Liquidity & Digital Asset Markets (Crypto Glossary)
- Primary Data Source: Federal Reserve H.4.1 Statistical Release
- Reference Period: Week ending September 16, 2026; H.4.1 release published September 17, 2026
- Research Scope: Fed assets, liabilities, reserve balances, Treasury General Account (TGA), Overnight Reverse Repurchase Agreement Facility (ON RRP), securities holdings, and balance-sheet mechanics