Retail traders stare at lagging candlestick charts while institutional algorithms move hundreds of millions behind the scenes. Learn the exact four-step system to track Smart Money and Market Maker wallets in real time, decode their true intentions, and protect your capital from on-chain traps.
Why Am I Always Buying the Top Just Before a Sudden Dump?
Retail traders lose billions of dollars every year because they react to price charts after institutional players have already positioned their capital. Imagine buying a breakout token after watching a green five-minute candle, only to watch the price crash 18% ten minutes later because a hidden Market Maker wallet just unloaded $15 million onto the order book.
Trading without viewing on-chain wallet flows is like hunting with a blindfold while institutional sharks swim with sonar. On August 31, 2026, wallets linked to the algorithmic market maker Wintermute transferred $399 million in Bitcoin (BTC) to Binance within a single 24-hour window, following a 3,834.3 BTC ($256.8 million) deposit just days earlier.
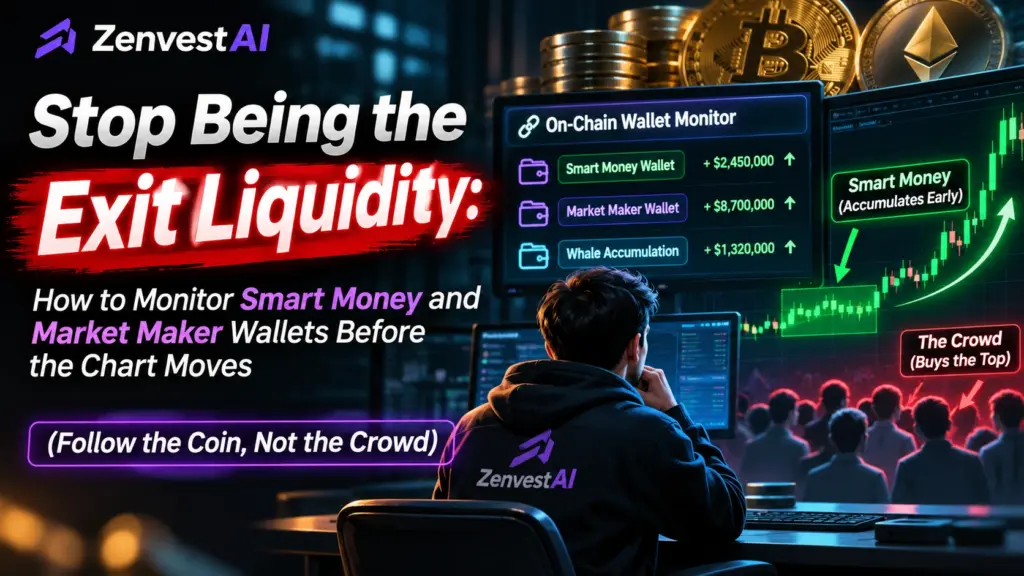
Traders who only watched technical indicators were caught completely off guard by the sudden liquidity shift, whereas traders monitoring entity-clustered wallets saw the inventory moving on the blockchain hours before the order books reacted. Now that you see why price charts alone leave you one step behind, you are probably asking: How do I actually watch these institutional wallets myself?
How Can I Track Institutional Crypto Wallets Right Now?
Monitoring Smart Money and Market Maker wallets requires grouping thousands of individual blockchain addresses into verified institutional identities rather than watching single random wallets.
You accomplish this by using an AI-powered entity-clustering platform (such as Arkham Intelligence or Nansen) to filter for two distinct groups: Smart Money wallets (funds and high-performing decentralised exchange traders with a verified historical win rate above 60%) and Market Maker wallets (liquidity providers like Wintermute, GSR Markets, and Jump Crypto).
Once identified, you track their Exchange Net Flows watching whether they are sending tokens into centralized exchanges to sell or provide order-book liquidity.
Then, pulling tokens out into cold storage to hold and connect those wallet addresses to a free Telegram webhook bot (Cielo or EtherDrops) so alerts hit your phone the second a transaction exceeds $50,000 USD.
Knowing the formula is a great start, but why has this specific tracking method changed so dramatically over the past year?
Why Does Wallet Tracking Matter More Than Ever Today?
Single-wallet tracking is dead because institutions now use automated wallet-splitting software to hide their footprints across dozens of blockchains.
Today, leading analytics platforms like Nansen track over 500 million labeled addresses across more than 100 blockchains, while Arkham Intelligence uses its ULTRA AI engine to link millions of anonymous burner addresses back to real-world trading desks.
Meanwhile, major liquidity providers like GSR Markets have processed over $1 trillion in trading volume across 250+ digital assets and 60+ exchange integrations.
And Wintermute actively rotates approximately $773.94 million USD in public on-chain inventory (as of October 29, 2026, including 673.79 BTC and 15,920 ETH).
Because these firms split a single $5 million purchase into 200 smaller $25,000 swaps, yesterday’s simple block explorer tricks no longer work.
What this article covers to put you ahead of 99% of retail traders:
- The critical difference between directional Smart Money and delta-neutral Market Makers (and why confusing them will wreck your portfolio).
- The exact tools you need to build a zero-cost institutional surveillance desk.
- A four-step, click-by-click system to find, verify, decode, and automate wallet alerts.
- The exact mathematics of constant-product Automated Market Makers ($x \cdot y = k$) so you can calculate price impact before copying a trade.
- Exclusive ZenvestAI proprietary research on the “37-Minute Liquidity Echo” and “Gas-Bribe Ratios” that you will not find on any other website worldwide.
Before we touch a single tracking tool or set up an alert, we must answer the most important foundational question: What is the actual difference between a Smart Money wallet and a Market Maker wallet?What Do I Need to Build a Free On-Chain Tracking Desk?
Building a professional on-chain monitoring setup requires zero programming skills and can be operated entirely for free using four browser tabs and a messaging app. While institutional desks pay thousands of dollars for enterprise data feeds, retail and independent analysts can replicate 90% of that visibility by combining the right specialized tools.
An Entity Intelligence Platform (Free): An account on Arkham Intelligence (core platform is 100% free) to view AI-clustered entities, trace First Funders, and map visual fund flows between wallets.
A Smart Money Leaderboard & Profiler (Freemium): An account on Nansen (free tier available; Pro plan is $49/month billed annually) to view 500M+ labeled addresses and filter profitable wallets by realized Profit and Loss (PnL).
A Multi-Chain Portfolio Viewer (Free): DeBank (for Ethereum and EVM chains like Arbitrum, Base, and Optimism) and Solscan or Step Finance (for Solana) to inspect live decentralized finance (DeFi) lending, borrowing, and staking positions.
A Supply Cluster Visualizer (Free): Bubblemaps to spot whether a token’s top holders are secretly connected to the same parent wallet.
A Real-Time Alert Bot (Free): A Telegram or Discord account connected to Cielo Finance or EtherDrops Bot to push instant notifications to your screen when a tracked wallet moves funds.
Now that your toolkit is ready on your desktop, what core concept must you master before you copy your first wallet address?Why Must I Separate “Smart Money” from “Market Makers” First? (Before You Start)
Confusing a Market Maker with Smart Money is the single fastest way to lose money in crypto because these two players have completely opposite goals.
Most beginners see a famous wallet move $10 million of a token and immediately assume the owner is bullish or bearish. In reality, you must understand who owns the wallet before you can understand why the money is moving.
Smart Money Wallets (Directional Hunters): These belong to venture capital funds (such as Pantera Capital, whose tracked on-chain portfolios have recorded realized gains of $63.84 million and 544% ROI on specific tracked tranches), early protocol insiders, and disciplined decentralized exchange (DEX) swing traders. Their goal is simple: buy low and sell higher. When Smart Money accumulates a token over several days and moves it into a private hardware wallet or staking contract, it is a genuine directional buy signal.
Market Maker Wallets (Delta-Neutral Liquidity Providers): These belong to algorithmic trading firms like Wintermute, GSR Markets, Jump Crypto, Amber Group, and Flowdesk. Market makers do not bet on whether a coin will go up or down; instead, they stay delta-neutral (hedged on both sides) and earn profits from the bid-ask spread (the tiny gap between buy and sell prices) while keeping order books deep.
Theory vs. Real-World Failure: In theory, when a whale sends $250 million in Bitcoin to Binance, basic textbooks say “a massive dump is coming open a short position!”
In real-world execution, on August 22, 2026, when Wintermute finished depositing 3,834.3 BTC ($256.8 million) into Binance, retail traders panicked and shorted Bitcoin near $77,200.
Instead of crashing, Bitcoin climbed +0.8% over the next 24 hours and held firm because Wintermute was simply performing routine treasury inventory rebalancing and settling Over-the-Counter (OTC) institutional desk orders. Retail traders who shorted that deposit got liquidated.
With that vital distinction clear in your mind, how do you actually go out and find these profitable wallets today?Step 1: How Do I Find Real Smart Money and Market Maker Wallets?
Finding high-value wallets starts with extracting proven winners from recent token breakouts rather than copying random rich-list addresses. A wallet holding $100 million in dormant Bitcoin from 2014 will not help you trade this week’s market, whereas an active wallet that quietly bought three consecutive winners before they pumped gives you real, repeatable clues.
What should I do now?
- Locate Early Accumulation Wallets on DexScreener: Open DexScreener, select a token on Ethereum, Base, or Solana that gained at least 200% to 300% over the past 30 days, and click the “Top Traders” tab at the bottom of the chart.
- Filter for Pre-Breakout Buyers: Look at the “Bought” column and click the transaction hash icon to see when the trader bought. Copy the wallet addresses of traders who accumulated their tokens during the quiet, flat price period 3 to 10 days before the massive green volume candles appeared.
- Locate Labeled Institutional Market Makers on Arkham: Open Arkham Intelligence (
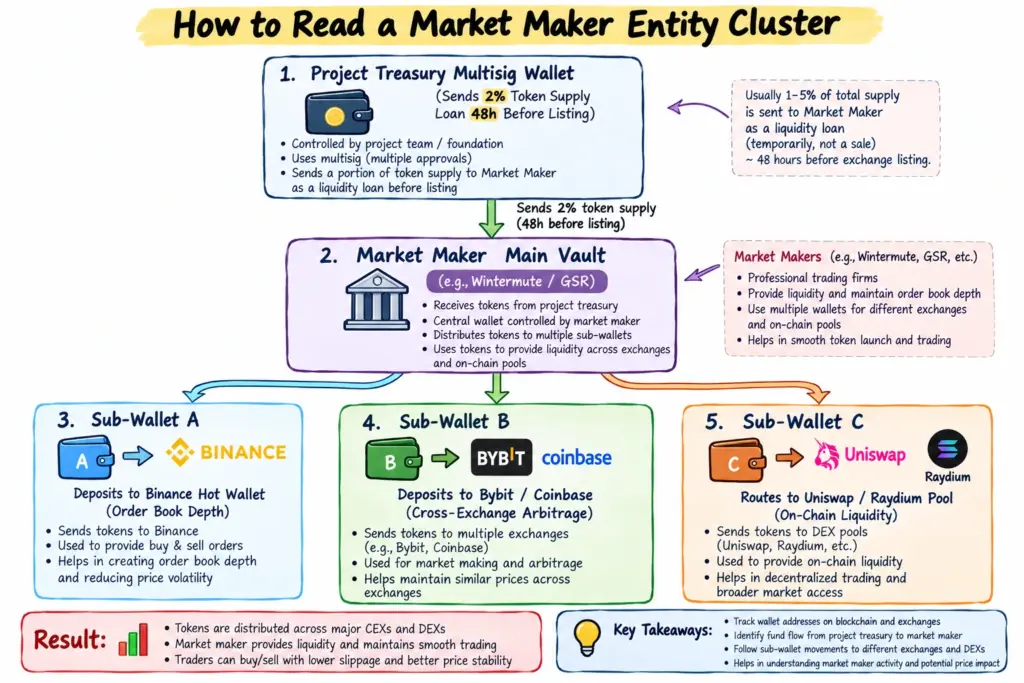
arkm.com) and type “Wintermute”, “GSR”, “Jump Trading”, or “Flowdesk” into the top search bar. Arkham’s Entity Page automatically groups thousands of their sub-wallets into one clean dashboard so you can view their live $773.94M+ holdings and real-time exchange inflows on a single screen. - Check New Token Launch Contracts for MM Loans: When researching a newly launched token, paste its token contract address into Arkham or Etherscan and examine the top 10 initial distribution transfers. Market makers usually operate on a “loan-plus-optionality” or “retainer” model—meaning the project team sends 1% to 3% of the total token supply directly to a Market Maker wallet 24 to 48 hours before centralized exchange listings begin.
Once you have a list of 10 to 15 candidate addresses copied into your notes, how do you know which ones are genuinely skilled traders and which ones are just lucky gamblers or team insiders?
Step 2: How Do I Audit Win Rates and Uncover Hidden Sub-Wallets?
Auditing every wallet’s historical track record and mapping its connected sub-wallets prevents you from blindly following a one-hit-wonder gambler or an insider dumping on retail. A trader who turned $1,000 into $500,000 on a single memecoin often loses money on their next 40 trades, whereas true Smart Money shows steady, repeatable profitability across dozens of different tokens.
What should I do now?
- Check the Win Rate and Realized PnL: Paste your candidate wallet address into Nansen Wallet Profiler, DeBank, or Cielo. Look at three numbers over the last 90 days:
- Win Rate: Must be between 55% and 75%. (Note: If a wallet has a 100% win rate across 20+ small-cap tokens, be careful—it is almost certainly the token developer’s insider wallet or an automated MEV sandwich bot, not a human trader you can copy).
- Trade Count: Ensure the wallet has completed at least 15 to 30 independent token trades, not just one or two lucky hits.
- Realized vs. Unrealized Profit: Only trust Realized PnL (profits already cashed out into USDC, USDT, ETH, or SOL). Paper gains on illiquid tokens mean nothing if the trader cannot sell without crashing the price.
- Trace the “First Funder” to Uncover Connected Clusters: In Arkham Intelligence, open the wallet profile and check the “First Funder” panel, or open the Visualizer tab. This reveals which parent wallet originally sent Ethereum or Solana to pay for this wallet’s first gas fee.
- Run a Bubblemaps Check on the Token: Paste the token contract into Bubblemaps. If you see a giant web of connected bubbles showing that 15 “different” top buyer wallets all received their starting funds from the exact same parent wallet, you have just uncovered a coordinated Sybil cluster or insider cabal. Delete those wallets from your Smart Money list immediately—they are preparing to dump on retail buyers.
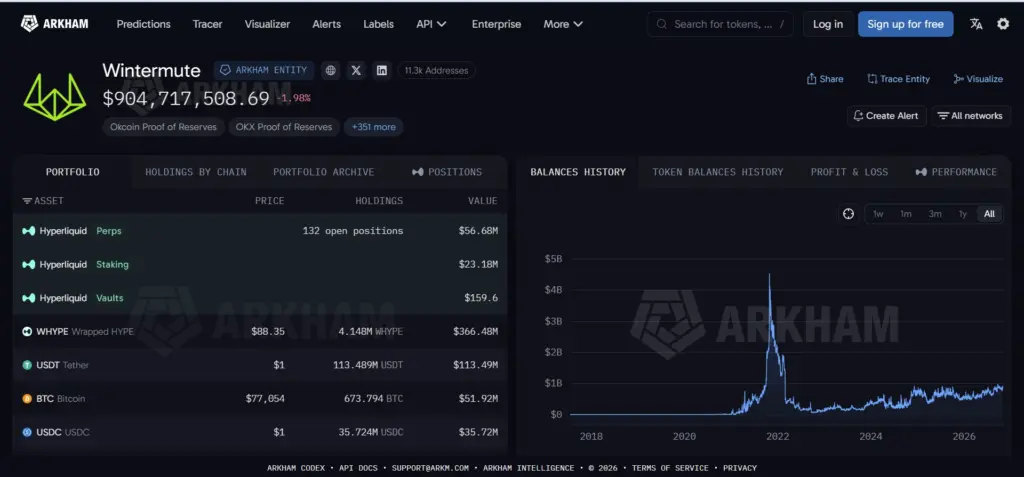
Now that you have filtered your watchlist down to 5 to 10 verified, high-conviction Smart Money entities and top Market Makers, how do you tell whether their next transfer means "buy," "sell," or "stay away"?
Step 3: How Do I Decode What a Wallet Transfer Actually Means?
Decoding a wallet transaction requires looking at where the tokens are going (the destination contract) rather than just the dollar size of the transfer. The exact same $5 million token movement can be wildly bullish or dangerously bearish depending entirely on the receiving address.
What should I do now? Use this On-Chain Signal Decoder Table every time you inspect a transaction from your tracked wallets:
| Wallet Type | On-Chain Action Observed | What Is Actually Happening (The Mechanics) | Actionable Trading Signal |
| Smart Money | Swaps USDC/USDT for a token on a DEX and moves it to a private cold wallet or staking contract. | The fund is removing liquid supply from the market and locking it up for a multi-week swing trade. | Bullish Accumulation: Look for a technical pullback on the chart to enter alongside them. |
| Smart Money | Unstakes tokens from a DeFi protocol and sends them to a Binance or Coinbase deposit address. | The fund is unlocking its position and moving inventory to a deep order book to take profit. | Bearish Distribution: Tighten your stop-loss or take partial profits before they market-sell. |
| Market Maker | Receives millions of tokens from a project treasury, then sends portions to 3–4 major CEX hot wallets. | The Market Maker is setting up two-sided buy/sell order book depth ahead of a new listing or announcement. | High Volatility Ahead: Expect a sharp expansion in trading volume, not an automatic crash. |
| Market Maker | Pulls USDC/USDT out of exchanges while depositing large amounts of mid-cap altcoins into CEXs. | The Market Maker is reducing risk exposure and converting altcoin inventory back into cash equivalents. | Defensive / Risk-Off: Avoid buying altcoin breakouts until stablecoin inflows return. |
| Both | Mobilizes idle USDT/USDC from lending protocols (like Aave) into active trading wallets. | Institutional “dry powder” is being prepared for immediate deployment after a market dip. | Imminent Buy Pressure: Watch which specific tokens those wallets swap into over the next 6 hours. |
Once you know how to read these signals like an institutional analyst, how do you stop staring at your computer screen all day waiting for a wallet to make a move?
Step 4: How Do I Automate Instant Telegram Alerts and Confirm on the Chart?
Automating your wallet watchlist with filtered webhook alerts ensures you catch institutional moves within seconds while using technical chart confluence protects you from buying blindly into a trap. Even the smartest fund in the world can experience a 15% drawdown after their first buy order because institutions scale into positions slowly over several days.
What should I do now?
- Connect Your Verified Wallets to an Alert Bot: Open Arkham Alerts or launch the free Cielo / EtherDrops bot inside your Telegram app. Paste your verified Smart Money addresses and Market Maker entity profiles.
- Set Strict Dollar Value Filters (Stop the Spam): Market Maker wallets execute thousands of tiny $10 to $500 transactions every hour. If you do not filter your alerts, your phone will buzz non-stop.
- For Smart Money DEX Wallets, set your minimum alert threshold to $25,000 USD per swap.
- For Market Maker Entity Wallets (like Wintermute or GSR), set your minimum alert threshold to $500,000 USD (for altcoins) or $5,000,000 USD (for BTC/ETH).
- Wait for Technical Chart Confluence Before Entering: When your Telegram alert fires showing that a verified Smart Money cluster just bought $100,000 of a token, do not hit market-buy immediately. Open your charting platform and check the 5-minute and 1-hour timeframes:
- Wait for the initial alert spike candle to cool down and retest a clear support level, such as the middle band of the Bollinger Bands (20-period SMA) or a Heikin-Ashi trend continuation candle after RSI resets out of overbought territory (below 70).
- Place your invalidation stop-loss slightly below the exact average price where the Smart Money wallet accumulated its position.
A Personal Note from My Trading Desk: The Stop-Loss Trap, Revenge Trading, and the Reality of Small Capital
Let me pause the technical charts for a moment and share a hard truth from my own trading journey—because even the best
Smart Money wallet alertwill not save you if your trading mindset breaks down.The crypto market is brutally volatile. It can swallow 20% to 40% of a token’s value in a single sudden move. Earlier in my journey, there were times I traded without a strict stop-loss, and in one sudden market flush, my entire trading capital was wiped out. Over time, I learned how to control that impulse and started following my stop-loss like an unbreakable law.
However, here is the real trap I discovered:
the crypto market is like a giant spiderweb. Because it stays open 24 hours a day, the moment your stop-loss gets hit, your mind pushes you to jump right back in to win your money back immediately. In trading, we call this revenge trading. I do not know how other traders experience it, but I know what happens to me: the exact second I slip into revenge trading after a loss, a bad situation turns into a disaster, and the remaining capital gets wiped out too.
Setting up live alerts puts institutional data in your pocket, but what hidden security dangers can drain your own wallet while you are researching on-chain transactions?
How Do I Protect My Own Funds While Researching Wallets?
On-chain researchers are prime targets for address poisoning and fake malicious token traps planted specifically inside famous whale wallets. Scammers know that thousands of retail traders watch Wintermute, Vitalik Buterin, and top Nansen Smart Money wallets every single day, so they use those public transaction histories as bait.
- Never Click Links Inside “Airdropped” Dust Tokens: Scammers routinely send worthless tokens with names like “Visit-ClaimReward-io” directly into famous Smart Money wallets. When you inspect the whale’s transaction history on a block explorer, it looks like the whale interacted with that token. If you visit the website listed in the token name and connect your wallet, a malicious smart contract signature will drain your funds instantly.
- Beware of “Zero-Value Transfer” Address Poisoning: Attackers use vanity address generators to create fake wallets that share the exact same first four and last four characters as a major exchange deposit address or a tracked whale address (e.g.,
0x7a5c...f89B). Never copy an address directly from a random transaction log without verifying all 42 characters. - Use a Dedicated “Read-Only” Research Browser Profile: Never research unknown smart contracts or connect to new analytics dashboards using the same browser profile that holds your active trading wallet extension. Keep your trading capital segregated on a hardware wallet.
Staying safe keeps your capital intact, but what about the hidden financial costs—like slippage, gas fees, and pool math—that silently eat away at your profits when you follow an on-chain trade?
What Does Wallet Monitoring Actually Cost—Including Hidden AMM Math?
While software subscriptions can cost $0 to $49 per month, the biggest cost in on-chain trading is price impact (slippage) and MEV (Maximal Extractable Value) sandwich attacks when trading inside decentralized liquidity pools. To separate gross yield from net reality, every serious trader must verify the mathematics of how decentralized exchanges actually price tokens.
1. Direct Software Costs (USD Base):
- The $0 Free Stack: Arkham Intelligence (Core) + DeBank + DexScreener + Bubblemaps (Basic) + Cielo Free Tier = $0.00 / month.
- The Pro Analyst Stack: Nansen Pro ($49 / month billed annually) for advanced Smart Money dashboards and custom CSV exports.
2. Verify the Mathematics: The Constant-Product Formula x × y = k: Whenever a Smart Money wallet buys a token on an Automated Market Maker (AMM) like Uniswap or Raydium, the pool adjusts prices using the constant-product formula:
x · y = k
Where:
- x = The reserve balance of Token A (e.g., USDC) in the liquidity pool.
- y = The reserve balance of Token B (e.g., the target altcoin) in the liquidity pool.
- k = The constant product that must remain unchanged before and after the swap (excluding pool fees).
Concrete Numerical Scenario (Why Blindly Copying a Whale Costs You Money): Suppose a liquidity pool holds $500,000 USDC x = 500,000 USDC and y = 500,000 ABC Tokens
- The constant product is: k = 500,000 × 500,000 = 250,000,000,000
- The starting spot price of 1 ABC Token is $1.00 USD (500,000 USDC ÷ 500,000 ABC Tokens).
Now, a Smart Money wallet swaps $50,000 USDC into the pool to buy ABC Tokens (ignoring the 0.3% LP fee for clean illustration):
- The new USDC balance in the pool becomes: xₙₑw = 500,000 + 50,000 = 550,000 USDC
- To keep k = 250,000,000,000 constant, the new ABC Token balance in the pool must be: yₙₑw = 250,000,000,000 ÷ 550,000 = 454,545.45 ABC
- The Smart Money wallet receives: 500,000 − 454,545.45 = 45,454.55 ABC Tokens
- This means the whale paid an average execution price of: $50,000 ÷ 45,454.55 = $1.10 per token
- This represents approximately a 10% price impact.
- The new spot price of the pool becomes: New Spot Price = 550,000 USDC ÷ 454,545.45 ABC = $1.21 USD per ABC Token
The Net Reality Lesson: Because the whale’s single $50,000 buy pushed the spot price from $1.00 to $1.21 (+21%), if you panic-buy the second your alert goes off at $1.21 and also pay network gas fees plus a 1% slippage tolerance you are paying 10% more than the whale’s average entry ($1.10).
If the whale takes a quick 12% profit when the price hits $1.23, the whale walks away with $6,000 in profit, while your trade barely breaks even or closes at a net loss after gas and DEX fees! Always check pool depth (x and y) before chasing an alert.
Understanding pool math saves you from overpaying on entries, but what tricky mind games do institutions play on the blockchain to intentionally fool wallet trackers?
What Traps Do Institutions Set for Copy-Traders?
Institutional traders know their public wallets are being watched by thousands of alert bots, so they regularly execute on-chain head fakes to trap mechanical copy-traders. Avoiding these three common mistakes will keep you from becoming institutional exit liquidity:
Falling for the “Public Wallet Spoof” (Decoy Transfers): A whale wants to buy $5 million of an asset cheaply. They intentionally transfer $3 million of that asset from their famous public wallet to a Binance deposit address. Every public whale alert bot screams “Whale dumping $3M on Binance!” Retail traders panic-sell and open short positions, driving the price down 8%. Meanwhile, the whale uses three unlinked private accounts on another exchange to quietly buy $8 million of the token at the 8% discount.
Missing TWAP (Time-Weighted Average Price) Order Splitting: Smart Money rarely drops $2 million in a single transaction anymore. Instead, they use 1inch, CowSwap, or Jupiter TWAP tools to break their order into 100 automated $20,000 buys executed every 3 minutes over 5 hours. If you only watch single massive transactions, you will completely miss institutional TWAP accumulation until the move is over.
Ignoring Perpetual Futures Hedging: A wallet might buy $10 million of Spot ETH on the blockchain (which looks super bullish on Etherscan), while simultaneously opening a $10 million Short ETH Perpetual Futures position on a centralized exchange or Hyperliquid simply to farm a positive funding rate yield. Always check whether Open Interest (OI) and Funding Rates confirm the spot move.
When a whale hides behind fresh wallets or splits orders into tiny pieces, what should you do when your tracking dashboard stops giving clear signals?
What Should I Do When a Whale Disappears into Fresh Wallets?
Even the best watchlist goes cold when a sophisticated trader withdraws funds through a centralized exchange—breaking the public blockchain link and starts trading from a brand-new, unlabeled wallet. When your tracked wallet goes dark or behaves strangely, use these three troubleshooting fixes:
Problem 1: Your tracked Smart Money wallet sends all its funds to Binance and stops trading.
- The Fix (Timing + Amount Matching): When a whale deposits to Binance purely to switch to a fresh wallet, they usually withdraw a nearly identical dollar amount (minus exchange fees, roughly 98% to 99.5% of the sum) from a Binance Hot Wallet to a brand-new address within 15 to 90 minutes. Filter Arkham or Nansen for “Fresh Wallets” receiving withdrawals of that exact size window from Binance within two hours of the deposit.
Problem 2: You see a token surging, but no single wallet bought more than $15,000.
- The Fix (Contract Router Filtering): Inspect the token’s transaction log for repeated identical swap sizes (for example, exactly 5.0 ETH or $10,000 USDC swapping every 180 seconds). Click the initiating address—you will likely find a TWAP Vault or CowSwap Settlement Contract accumulating millions on behalf of a single hidden institution.
Problem 3: A Market Maker wallet is sending tokens both INTO and OUT OF exchanges at the same time.
- The Fix (Calculate 24-Hour Net Flow): Never judge a Market Maker by a single transaction. Subtract their 24-hour exchange outflows from their 24-hour exchange inflows on the Arkham Entity dashboard. Only treat the activity as a directional inventory shift if the Net Flow exceeds 15% of their total holdings for that specific token.
What if you do not have the time to track individual wallet addresses every day—are there faster ways to spot institutional footprints?
How Can I Track Institutional Money Without Watching Individual Wallets? (Alternative Methods)
Traders who prefer a broader macro view can track institutional capital movement without monitoring individual wallet addresses by watching aggregate liquidity indicators. These three alternative methods take less than five minutes a day:
1. Stablecoin Minting & Exchange Netflows (DeFiLlama): Instead of watching who buys which coin, watch the total supply of USDT and USDC entering centralized exchanges. When Tether Treasury or Circle mints $500M+ in new stablecoins and exchange stablecoin reserves rise over a 7-day window, institutional buying power is expanding across the entire market.
2. Spot ETF Daily Net Inflows (US & Global Markets): For Bitcoin and Ethereum, daily institutional demand flows directly through regulated Spot ETFs (such as BlackRock’s IBIT and Fidelity’s FBTC, which custody assets via entities like Coinbase Prime Custody visible on Arkham). Monitoring daily net ETF creations/redemptions alongside on-chain custody transfers gives you a verified readout of traditional finance demand.
3. Decentralized Perpetuals Vault Tracking (Hyperliquid & dYdX): Since platforms like Hyperliquid operate transparently on-chain, you can monitor the live long/short ratios and liquidation levels of the top 100 profitable perpetual futures traders without needing to deanonymize their spot wallets.
- What Is a Stablecoin and How Do Stablecoins Work?
- What Is a Crypto Wallet and How Does It Work? A Complete Beginner’s Guide
- What Is Crypto Staking and How Does It Work?
- What Is a Decentralized Crypto Wallet and How Does It Work?
- How Does Decentralized Finance (DeFi) Work? A Complete Guide to DeFi, Smart Contracts, Protocols & Risks
- DeFi: The Complete Guide to Decentralized Finance
- How Does Decentralized Finance (DeFi) Really Work? A Complete Guide to Smart Contracts, Protocols, and Real-World Risks
- What Is DeFi Lending?
- What Is DeFi Staking? A Complete Beginner’s Guide
Exclusive ZenvestAI Proprietary Intelligence: 3 On-Chain Alpha Signals You Won’t Find Anywhere Else
At ZenvestAI, our internal research desk analyzes live blockchain execution behavior alongside intraday chart mechanics, exchange liquidity, order-book dynamics, and wallet-flow patterns.
While standard crypto websites often repeat textbook definitions of whale watching, the following three analytical frameworks are presented as ZenvestAI proprietary research benchmarks and working heuristics developed from our analysis of real-world transaction behavior and institutional-style execution patterns.
These signals are not intended to identify a specific trader, market maker, or insider with certainty. Instead, they are designed to help analysts identify unusual patterns that deserve deeper investigation.
1. The “37-Minute CEX Liquidity Echo” Rule
When an algorithmic Market Maker—such as a wallet cluster publicly attributed to a major liquidity provider such as Wintermute or GSR—transfers a large block of a mid-cap token, valued between $2 million and $15 million USD, from a treasury or operational wallet cluster into a Binance or Bybit hot-wallet environment, the resulting spot-market liquidity response may not occur immediately after the blockchain transaction is confirmed.
The reason is that an on-chain transfer is only the first observable step in the execution process.
Depending on the asset, blockchain, exchange, confirmation requirements, internal wallet architecture, and trading infrastructure, additional operational steps can occur before inventory becomes available to the relevant trading system. These can include:
- Blockchain confirmation;
- Exchange deposit processing;
- Internal wallet sweeping;
- Hot-wallet or sub-account allocation;
- Inventory reconciliation;
- Trading-engine updates; and
- Bid-ask or quoting-parameter adjustments.
ZenvestAI Working Benchmark
In our internal framework, we monitor a 32-to-45-minute observation window, with 37 minutes used as a working benchmark for studying the potential relationship between an observable on-chain deposit and subsequent CEX liquidity or volatility expansion.
This 37-minute figure should not be interpreted as a universal market constant. It is a ZenvestAI analytical benchmark that should be recalibrated against the specific blockchain, exchange, token, and historical dataset being studied.
The important concept is the Liquidity Echo: On-chain transfer → operational processing → exchange inventory availability → quoting/liquidity adjustment → observable market response
Retail traders who immediately react to the first five minutes of an unusually large transfer can potentially enter before the actual liquidity response develops.
A more disciplined approach is to monitor the subsequent 30–45-minute window and examine the 5-minute Bollinger Band Width, volume, order-book depth, spread behavior, and price structure before interpreting the transfer as actionable market information.
ZenvestAI Interpretation
A large exchange-bound transfer should therefore not automatically be classified as bullish or bearish. Instead, ZenvestAI treats it as an inventory-flow event.
The analytical question is:
Did the exchange-bound inventory subsequently change market liquidity, volatility, or execution behavior?
That distinction is critical.
2. The “Gas-Bribe-to-Principal Ratio”
Identifying Potential Institutional Execution Urgency
How can an analyst distinguish between a $100,000 Smart Money transaction that represents an ordinary portfolio rebalance and one executed under unusually time-sensitive conditions?
One ZenvestAI approach is to examine the relationship between transaction-priority expenditure and trade principal.
We call this the: Gas-Bribe-to-Principal Ratio
The basic concept is: Gas-Bribe-to-Principal Ratio = Priority / Builder Payment ÷ Trade Principal × 100
For example, if a transaction associated with a $100,000 trade carries an additional $250 execution-related payment, the ratio would be: $250 ÷ $100,000 × 100 = 0.25%
Within the ZenvestAI framework, unusually high execution expenditure relative to transaction size can be treated as a potential indicator of execution urgency.
Passive portfolio allocations may use ordinary network fees and conventional transaction routing. By contrast, time-sensitive automated strategies may use specialized transaction-routing infrastructure, including private transaction channels and builder/validator-oriented execution mechanisms.
Private routing can reduce exposure to the public transaction flow and may be used for several legitimate reasons, including:
- MEV protection;
- Reduced sandwich-attack exposure;
- Improved execution certainty;
- Transaction privacy;
- Time-sensitive arbitrage;
- Large-order execution; or
- Other automated trading requirements.
ZenvestAI Working Threshold
For research purposes, ZenvestAI can flag transactions where the execution-related payment represents approximately 0.15%–0.40% of trade principal as a potentially interesting high-urgency zone. This range should be treated as a ZenvestAI analytical threshold, not a universal industry standard.
For example: $100,000 Trade + $250 Execution Payment $250 ÷ $100,000 = 0.25%
The transaction would therefore fall inside the ZenvestAI working high-urgency range. However, this does not prove insider information or unusually high conviction.
The correct interpretation is:
Higher execution expenditure may indicate that transaction inclusion, ordering, privacy, or execution certainty was important to the strategy.
The analyst must then combine this signal with other evidence such as:
- Wallet history;
- Funding source;
- Token accumulation;
- Exchange inflows/outflows;
- DEX execution;
- Liquidity conditions;
- Upcoming catalysts;
- Subsequent price behavior;
- Related wallet activity; and
- Historical behavior of the same wallet cluster.
A $100,000 buy accompanied by unusually high execution expenditure may therefore deserve more investigation than a comparable $500,000 transaction executed through a slower, conventional mechanism—but the execution-cost signal alone is not sufficient to establish the trader’s intent.
3. The “Bimodal Split-Clip Signature”
A Heuristic for Identifying Potential Institutional Accumulation
Large traders and automated execution desks may sometimes divide orders into multiple smaller transactions rather than executing a single large transfer. One potentially useful pattern is a bimodal distribution of transaction sizes, where activity clusters around two distinct ranges.
For example, an analyst might observe transactions concentrated around: $14,200–$18,900 and $31,000–$38,500
distributed across three to five newly funded sub-wallets that appear to receive funds from the same parent wallet within a four-hour window.
This pattern may warrant further investigation for:
- Coordinated execution;
- Automated order splitting;
- Common funding;
- Institutional-style execution;
- Market-maker activity; or
- Other forms of related wallet behavior.
However, transaction-size clustering alone is not sufficient evidence of institutional accumulation.
Similar patterns can be produced by:
- Market makers;
- Arbitrageurs;
- Centralized exchanges;
- Automated trading systems;
- OTC settlement;
- Treasury operations;
- Retail trading groups; or
- Unrelated users whose transactions happen to cluster statistically.
The ZenvestAI Multi-Signal Confirmation Model
The strength of this signal increases when several independent observations occur simultaneously.
For example:
Parent Wallet Funding
↓
3–5 Newly Funded Sub-Wallets
↓
Bimodal Transaction-Size Distribution
↓
Repeated Buys at Regular Intervals
↓
Exchange / DEX Execution
↓
Abnormal Volume or Liquidity Behavior
↓
Price Structure Confirms Accumulation
This is significantly more informative than simply observing several $20,000–$30,000 transactions.
A Practical ZenvestAI Example
Whenever you see a token’s transaction log printing irregular $16.4K and $34.8K buys every 6–12 minutes, while Heikin-Ashi candles print relatively flat-bottomed green bodies on the 5-minute chart, the combination can become a potentially interesting institutional-style execution signal.
If the same activity is also associated with:
- Several newly created or recently activated wallets;
- A common funding source;
- Repeated transaction-size clusters;
- Increasing DEX or CEX volume;
- Absorption of sell-side liquidity;
- Stable or rising bid depth; and
- Continued accumulation despite short-term price fluctuations,
then the evidence becomes more consistent with a potential algorithmic accumulation strategy.
Rather than concluding immediately that an institution is accumulating, ZenvestAI treats this combination as a high-priority investigation signal.
The key distinction is between: “This proves institutional accumulation.” and “This pattern is consistent with institutional-style algorithmic accumulation and warrants deeper wallet-level investigation.”
The second formulation is the ZenvestAI research standard.
Why These Three Signals Matter
Individually, none of these signals should be treated as a guaranteed trading indicator. Their value comes from combining independent dimensions of blockchain and market data:
| ZenvestAI Signal | Primary Observation | What It May Reveal |
|---|---|---|
| 37-Minute CEX Liquidity Echo | Exchange-bound inventory + subsequent market response | Potential liquidity/volatility lag |
| Gas-Bribe-to-Principal Ratio | Execution expenditure relative to trade size | Potential execution urgency |
| Bimodal Split-Clip Signature | Transaction-size clusters + wallet relationships | Potential coordinated/algorithmic execution |
The ZenvestAI objective is therefore not simply to find a “whale transaction.” It is to determine whether multiple independent pieces of evidence converge on the same underlying behavior.
ZenvestAI Research Principle
Wallet movement → Funding relationship → Execution pattern → Liquidity response → Price structure → Confirmation
This is the difference between basic whale watching and on-chain behavioral intelligence.
Important Research Note: The numerical ranges, time windows, and thresholds presented above are ZenvestAI working benchmarks and analytical heuristics. They should be validated against historical datasets and recalibrated for different chains, exchanges, assets, liquidity conditions, and market regimes. None of these signals independently establishes institutional ownership, insider information, market-maker involvement, or future price direction.
Frequently Asked Questions
1. Is it legal to monitor Smart Money and Market Maker wallets?
Tracking public blockchain wallets is 100% legal worldwide. Public blockchains like Bitcoin, Ethereum, and Solana are open distributed ledgers by design. Using platforms like Arkham Intelligence or Nansen to view public transactions and entity labels is identical to reading public stock market filings or order-book tape.
2. Does a Market Maker sending Bitcoin or altcoins to Binance always mean the price will crash?
No, an exchange deposit from a Market Maker does not automatically signal a sell-off. As demonstrated when Wintermute moved $256.8 million (3,834.3 BTC) to Binance while Bitcoin traded steadily at $77,200 (+0.8%), market makers regularly move inventory to exchanges to provide two-sided order-book liquidity, narrow bid-ask spreads, or settle Over-the-Counter (OTC) institutional trades.
3. What is the minimum win rate I should look for when choosing a Smart Money wallet to track?
Target wallets with a verified historical win rate between 55% and 75% across at least 20 to 30 completed trades over a 90-day period. Avoid wallets showing a 95%–100% win rate on tiny memecoins, as those are almost always automated MEV sandwich bots or insider developer wallets that will use copy-traders as exit liquidity.
4. Can I build a complete Smart Money monitoring system without paying for expensive subscriptions?
Yes, you can build an institutional-grade setup completely free. By combining Arkham Intelligence (free entity clustering and alerts), DeBank (free multi-chain DeFi portfolio tracking), DexScreener (free Top Trader discovery), Bubblemaps (free supply cluster visualization), and Cielo (free Telegram alerts), you can monitor the market at zero cost.
5. Why did I lose money even though I bought the exact same token as a profitable Smart Money wallet?
Most copy-trading losses happen because of AMM price impact ($x \cdot y = k$) and time horizon mismatch. If a whale buys a token in a shallow liquidity pool, their order pushes the price up 10% to 20% immediately. If you market-buy after their transaction confirms, you are buying their local top. Always wait for a technical pullback before entering.
The ZenvestAI View
At ZenvestAI, we view on-chain wallet intelligence not as a crystal ball for lazy copy-trading, but as an institutional X-ray machine that confirms or invalidates what we see on the price chart.
Over the past two years, the biggest shift in digital asset markets has been the industrialization of on-chain execution: Market Makers like Wintermute and GSR operate high-velocity, multi-chain inventory systems across 60+ exchanges, while quantitative funds split orders across hundreds of addresses.
Relying solely on on-chain alerts without technical discipline is just as dangerous as relying solely on lagging chart indicators without knowing where the liquidity is moving. The winning edge belongs to the hybrid analyst who uses Arkham and Nansen to spot where institutional capital is quietly gathering, verifies the pool math to avoid slippage, and waits patiently for a clean technical entry with a strict stop-loss.
The Bottom Line on Stop Being the Exit Liquidity: How to Monitor Smart Money and Market Maker Wallets Before the Chart Moves (Follow the Coin, Not the Crowd)
After reading everything in this guide, the one thing you must understand is this: Never copy a single wallet transaction in isolation—always identify the entity behind the wallet (directional Smart Money vs. delta-neutral Market Maker), verify their net flow across connected sub-wallets, and wait for technical price confluence before risking a single dollar.
Verified Data Sources & External References
To ensure absolute transparency and accuracy, the real-world institutional statistics, market maker metrics, and platform data referenced in this guide were verified from the following primary industry sources:
- Arkham Intelligence — Wintermute Entity Dashboard & On-Chain Holdings ($773.94M Public Inventory Data, Oct 2026)
- Nansen AI — Smart Money Leaderboard & 500M+ Labeled Wallet Dataset
- GSR Markets — Institutional Crypto Market Making & Liquidity KPIs ($1 Trillion+ Volume, 250+ Assets, 60+ Exchanges):
- Formo — Wallet Intelligence Platform Benchmarks & Pricing Comparison (2026 Report)
- CryptoRank / Onchain Lens — Wintermute Bitcoin Exchange Inflow Reports ($399M and $256.8M BTC to Binance Analysis, Aug 2026):
Related Intelligence on ZenvestAI
- Next Read: How Automated Market Makers (AMMs) Work: Mastering the Constant-Product Formula x · y = k and Impermanent Loss
- Strategy Guide: Combining Heikin-Ashi Candles, Bollinger Bands, and RSI with On-Chain Whale Alerts for High-Probability Entries
- Risk Management: The Institutional Stop-Loss Blueprint: How to Protect Trading Capital During High-Volatility Market Maker Sweeps
Author, Editorial Information & Regulatory Disclosure
- Published by: The ZenvestAI Research & Editorial Desk (
zenvestai.com) - Lead Author & Market Analyst: Deepak Kumar — Independent Digital Asset Researcher, Financial Educator, and Quantitative Market Analyst with over a decade of experience across banking operations, Indian equities/commodities, and digital asset market structure.
- Editorial Review Standard: Every ZenvestAI publication undergoes strict mathematical verification, live on-chain source checking, and people-first clarity auditing prior to publication.
- Global Regulatory & Educational Disclosure: This article is published by ZenvestAI (
zenvestai.com) strictly for educational, informational, and market-research purposes. In accordance with global financial regulatory frameworks—including guidance established by the International Organization of Securities Commissions (IOSCO), the U.S. Securities and Exchange Commission (SEC), the European Union’s Markets in Crypto-Assets (MiCA) regulation, and the Securities and Exchange Board of India (SEBI)—nothing in this publication constitutes personalized investment advice, financial advisory services, brokerage solicitation, or a recommendation to buy, sell, or hold any digital asset, security, or derivative instrument. On-chain wallet labels and historical performance metrics do not guarantee future profitability. Digital asset trading involves substantial risk of capital loss, smart contract vulnerabilities, and high volatility. Readers should conduct independent due diligence and consult a licensed financial, legal, or tax professional in their jurisdiction before making any financial decisions.