Markets are caught in a synchronized macro squeeze as Bitcoin slips below $70,000 and tech stocks wobble here is the exact data showing what breaks the downward pressure and sparks a real recovery.
Watching your screen turn red across both your crypto portfolio and your stock holdings on the exact same day creates a familiar knot of confusion and frustration.
On November 13, 2026, Bitcoin ($BTC) broke below $70,000, touching a three-month low near $67,568 to $69,000 (per CoinDesk and Binance spot data), while Ether ($ETH) slipped under $2,000 and Solana ($SOL) fell below $80.
Simultaneously, over $1.3 billion to $1.64 billion in leveraged crypto futures were wiped out in 24 hours, right as semiconductor and AI equities sold off following leadership shifts at Nvidia.
The immediate answer to what will drive crypto and stocks’ next rebound is not a secret software upgrade or a viral social media post, but global liquidity relief.
Both markets are currently moving as a single risk-asset trade weighed down by a U.S. Dollar Index ($DXY) surge above 103 and stubborn inflation data.
A durable rebound will only begin when three measurable triggers align: dollar exhaustion, cooler inflation prints ahead of the December Federal Reserve meeting, and a reversal from spot ETF outflows back into verified institutional buying.
Related Article: The TradFi List for Crypto Users: Stocks, Bonds, Dividends, Yield, Collateral, Spreads and More Explained
Why Are Both Crypto and Stocks Dropping at the Exact Same Time?
Understanding today’s sell-off requires looking at the cost of money rather than individual blockchain networks or company products.
When U.S. October Consumer Price Index (CPI) inflation rose 0.4% month-over-month against expectations of 0.3% (with core CPI holding firm at 0.3% for a third straight month), bond traders rapidly repriced interest rate expectations.
According to CME Fed Watch data cited across market desks on November 13, 2026, markets priced in roughly an 85% to 90% probability of a 25-basis-point Federal Reserve rate hike at the December 8–9 FOMC meeting, alongside an 11% to 15% tail risk of a half-point (50 bps) hike.
Higher borrowing costs strengthen the U.S. dollar, which acts like gravity on global asset prices.
As $DXY climbed above 103.17 its highest level in 19 months since April 2025 capital flowed out of growth stocks and digital assets into cash and Treasury yields.
Adding fuel to inflation fears, geopolitical tensions around the Strait of Hormuz kept WTI crude oil near $88 per barrel, reminding investors that energy shocks can keep central banks hawkish.
Now that you see why both markets are sinking in unison, a critical question naturally follows: what specific breakdown of events will actually guide us through this analysis?
What Will Drive Crypto and Stocks’ Next Rebound? The Dollar, Liquidity, and Buyer Triggers Explained
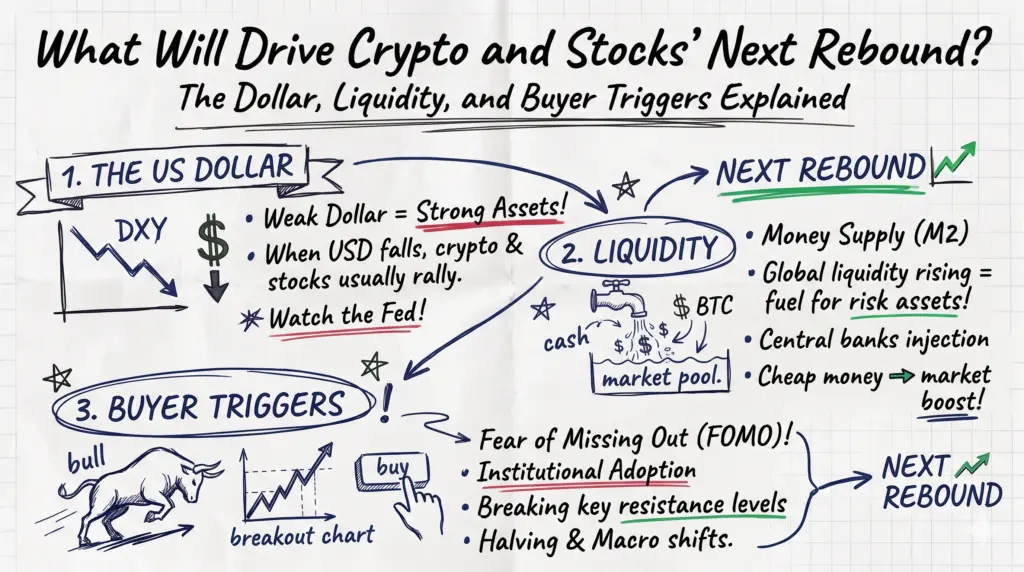
What This Guide Covers for Your Market Roadmap
This guide acts as a clear, step-by-step roadmap so you can separate short-term market noise from genuine recovery signals. Here is what we will unpack together:
- The Macro Relief Valve: How a cooling U.S. Dollar Index ($DXY) and upcoming Producer Price Index (PPI) data take the foot off the brake for risk assets.
- The Liquidity & ETF Engine: Why futures liquidations only clear old bets, and why U.S. spot Bitcoin ETF inflows and stablecoin supply must turn positive.
- The Tech & Earnings Spillover: How Nvidia’s Q3 earnings (November 17) and Anthropic’s Nasdaq IPO (November 19) directly influence crypto sentiment.
- Key Price Zones & Net Reality: Exact support and resistance levels on Bitcoin ($66,000–$73,000) and the hidden costs that separate paper gains from real returns.
- Original ZenvestAI Research: Proprietary cross-asset market observations synthesized by our research desk.
How Will a Weaker U.S. Dollar and Cooler Inflation Spark the First Relief Wave?
The single fastest trigger for a synchronized rebound in stocks and crypto is a peak and pullback in the U.S. Dollar Index ($DXY).
Because Bitcoin, global equities, and commodities are priced in U.S. dollars, a surging dollar automatically makes those assets more expensive for international buyers and tightens global financial conditions.
When $DXY pushes into the 103 to 104 resistance zone, institutional algorithms systematically reduce exposure to volatile assets like the Nasdaq 100 and Bitcoin.
Inflation data controls whether the dollar stays strong or retreats.
Markets were rattled by the hot October CPI print, which prompted Federal Reserve Governor Christopher Waller to note that a 50-basis-point rate hike should remain on the table if monthly core inflation stays at or above 0.3%.
Therefore, traders are laser-focused on upcoming U.S. Producer Price Index (PPI) and subsequent inflation releases.
If wholesale inflation prints softer than expected, bond yields will drop, $DXY will slip back below 103, and the immediate pressure on tech stocks and crypto will ease.
Wait—if lower yields and a softer dollar stop the bleeding, does that automatically guarantee a lasting bull run, or can a bounce fail without real cash entering the market?
Why Aren’t $1.3 Billion in Liquidations Enough to Start a Real Recovery?
A massive wave of futures liquidations clears out excessive leverage, but it never creates fresh buyers on its own.
When Bitcoin broke below $70,000 on November 13, 2026, Coinglass recorded over $1.3 billion in 24-hour liquidations including $677 million in Bitcoin positions and a single $31 million long wipeout on Hyperliquid.
Liquidation simply means an exchange forcibly closed a borrowed bet because the trader ran out of collateral.
Real recoveries require spot accumulation, where investors buy actual assets with cash rather than borrowed margin. Right now, two critical liquidity gauges show that cash is still sitting on the sidelines:
- U.S. Spot Bitcoin ETF Flows: Per SoSoValue tracking through early November 2026, U.S. spot Bitcoin ETFs slipped into net outflows for the year, recording five consecutive days of withdrawals totaling roughly $1.44 billion (while Ether ETFs saw around $1.6 billion in monthly outflows per Binance Research). Until daily ETF flow tables flip back to consistent net inflows, upward bounces remain fragile.
- Stablecoin Supply Contraction: According to Glassnode on-chain metrics, total stablecoin supply contracted by $14.2 billion over 30 days, marking the sharpest liquidity drain since 2022. Stablecoins are the dry powder of digital asset markets; a rebound in stablecoin minting is essential proof that new capital is entering crypto.
You like to read it: Anthropic IPO: Pricing Confusion, Valuation Concerns and What It Means for the AI and Crypto Markets
How Leverage Traps Turn Routine Pullbacks Into Cascades: Theory vs. Real-World Failure
In theory, when an asset becomes oversold such as Bitcoin’s daily Relative Strength Index (RSI) dropping toward 14 alongside a Binance Taker Buy/Sell Ratio of 0.85 (CryptoQuant) contrarian value buyers step in smoothly to stabilize the price.
In real-world practice, crowded leverage turns a routine 3% macro dip into a violent cascade.
When thousands of traders place stop-loss orders and high-leverage longs just under a round psychological number like $70,000, breaking that line triggers automated market sell orders worth $500 million within minutes.
The lesson for everyday investors is clear: never mistake an oversold bounce from short-covering for a confirmed trend reversal until spot volume backs it up.
While crypto waits for ETF buyers and stablecoin liquidity to return, what is happening on Wall Street that could either rescue or further drag down digital assets next week?
How Do Wall Street Tech Earnings and Oil Prices Decide Crypto’s Next Move?
Crypto and U.S. technology stocks share the exact same investor base in 2026, meaning a tech rebound can directly pull Bitcoin higher.
Earlier this week, semiconductor equities stumbled following Nvidia’s leadership transition news, sending Nvidia shares down roughly 4.3% and sparking broader anxiety over whether massive artificial intelligence spending will translate into immediate profits.
Two blockbuster Wall Street calendar events immediately ahead will test whether risk appetite is ready to return:
- Nvidia Q3 Earnings (November 17, 2026): Strong revenue guidance and proof of sustained enterprise AI demand can calm fears of a tech valuation slowdown, lifting the Nasdaq and restoring institutional appetite for high-beta assets like Bitcoin and Solana.
- Anthropic’s Nasdaq IPO (November 19, 2026): With institutional demand reportedly six times oversubscribed around a $1 trillion+ valuation target, a smooth public market debut would signal that big institutional funds still have deep capital ready to deploy into growth stories.
Alongside tech earnings, crude oil prices act as a hidden macro switch.
WTI crude hovering near $88 per barrel (just below its $89.15 weekly peak) due to Strait of Hormuz tensions keeps headline inflation elevated.
Any diplomatic de-escalation that drops oil below $80 per barrel would immediately reduce inflation anxiety across both stock and crypto trading desks.
If macro pressure eases and tech stabilizes, which exact price levels on the Bitcoin chart prove the rebound is real—and what risks still lurk beneath the surface?
Which Price Levels Confirm a Rebound and What Hidden Costs Affect Your Returns?
Price levels matter because institutional trading desks program their buy and sell orders around major technical zones. Rather than guessing the exact bottom, experienced analysts watch how Bitcoin behaves inside three clear ranges:
| Market Zone | Bitcoin ($BTC) Price Range | What It Means for the Rebound |
| Critical Demand Support | $66,000 – $68,500 | Buyers must defend this zone on daily closes. Losing $66,000 opens the door toward $64,000 or $60,000. |
| First Relief Hurdle | $70,000 – $70,400 | Reclaiming $70K turns the recent breakdown into a failed move (bear trap) and squeezes late short sellers. |
| Trend Confirmation Zone | $72,700 – $73,600 | Clearing the 200-day moving average (~$73K) on strong spot volume confirms a genuine structural recovery. |
Before acting on any rebound signal, remember to separate gross yield from net reality. Many decentralized finance (DeFi) dashboards and staking platforms advertise high annual percentage yields (APYs) during volatile market dips.
However, displayed protocol returns do not account for impermanent loss (divergence risk) in automated market maker pools where a sharp price swing between two paired tokens reduces your withdrawn value according to the constant-product formula (x × y = k) nor do they deduct network gas fees, slippage, or smart contract vulnerability risks. Always calculate net returns after fees and volatility drag.
Related Article: What Is Uniswap? Complete Guide to UNI, AMMs, Liquidity Pools & DEX Trading
Exclusive ZenvestAI Market Intelligence: 3 Cross-Asset Observations
At ZenvestAI, our research desk tracks cross-market liquidity mechanics that go beyond standard headline summaries. Below are three original analytical observations synthesized from November 2026 market structure data:
- The ‘Double-Liquidity Filter’ Threshold: Across major 2025–2026 macro drawdowns, Bitcoin rallies initiated while $DXY sits above 103 have historically failed within 10 trading days unless accompanied by at least three consecutive sessions of positive U.S. spot ETF inflows exceeding $250 million per day. Price bounces without the ETF filter act purely as short-term liquidity grabs.
- The $14.2B Stablecoin Velocity Lag: When on-chain stablecoin supply contracts by more than $10 billion over a 30-day window—as seen in November 2026’s $14.2 billion drop—altcoins like Ether and Solana typically lag Bitcoin’s initial recovery by 7 to 14 days because institutional desks rebuild BTC liquidity buffers before rotating capital down the risk curve.
- Semiconductor-to-Crypto Beta Compression: During weeks featuring mega-cap AI earnings (such as Nvidia on Nov 17) and tier-one tech IPOs (Anthropic on Nov 19), 24-hour rolling correlation between Nasdaq futures and Bitcoin tightens sharply during U.S. market hours, making macro equity catalysts a leading indicator for crypto overnight sessions.
Frequently Asked Questions
Why did Bitcoin drop below $70,000 if crypto fundamentals haven’t changed?
Bitcoin fell below $70,000 primarily due to macroeconomic tightening rather than a flaw in the Bitcoin network. A hotter-than-expected October U.S. CPI report (0.4% MoM) pushed the U.S. Dollar Index ($DXY) above 103 and raised odds of a December Federal Reserve rate hike, forcing leveraged traders to unwind over $1.3 billion in futures positions.
Will stocks and crypto rebound at the same time?
Yes, they are heavily correlated right now because institutional investors treat both mega-cap tech stocks and cryptocurrencies as liquidity-sensitive risk assets. A pullback in the U.S. dollar, softer inflation data, or strong earnings from Nvidia (Nov 17) can lift both markets together.
What is the single best indicator that a crypto recovery is real?
Watch U.S. spot Bitcoin ETF daily net inflows alongside Bitcoin reclaiming the $70,000–$73,000 zone on strong spot trading volume. Futures liquidations clear old debt, but sustained ETF inflows prove real institutional cash is returning.
How do Middle East tensions affect Bitcoin and tech stocks?
Geopolitical disruptions near the Strait of Hormuz keep WTI crude oil elevated near $88 per barrel. Higher oil prices feed into inflation, which makes the Federal Reserve less likely to cut interest rates—indirectly pressuring both stocks and crypto.
ZenvestAI View
Today’s downturn is a classic macro liquidity shakeout rather than a structural failure of digital assets or innovation equities. Excessive futures leverage amplified a dollar-driven pullback, pushing sentiment into extreme fear.
However, disciplined investors should avoid trying to catch a falling knife purely because indicators look oversold. Wait for the macro pressure valve specifically a cooling Dollar Index below 103 and positive spot ETF inflows to confirm that real buyers have stepped back into control.
The Bottom Line On What Will Drive Crypto and Stocks’ Next Rebound? The Dollar, Liquidity, and Buyer Triggers Explained
Key Takeaway: Crypto and stocks do not need hype to rebound they need liquidity relief. When the U.S. Dollar Index ($DXY) cools off from its 19-month highs, inflation prints soften ahead of December’s Fed meeting, and U.S. spot ETFs flip from outflows back to net buying, both markets will have the fuel required for a sustainable recovery.
Related Intelligence & Data Sources For The Post Taken:
All market statistics, inflation figures, and on-chain metrics referenced in this analysis are sourced from verified institutional and market data providers:
- CoinDesk Market Reports (Nov 13, 2026): Bitcoin price action below $70,000, U.S. Dollar Index ($DXY) 19-month high above 103, and WTI crude oil pricing — https://www.coindesk.com/markets/
- Coinglass Derivatives Data (Nov 13, 2026): 24-hour cross-exchange crypto futures liquidation totals ($1.3B+) and Hyperliquid single-position liquidation records — https://www.coinglass.com/LiquidationData
- CME Group FedWatch Tool (Nov 2026): December 8–9 FOMC interest rate hike probabilities (25 bps vs. 50 bps) — https://www.cmegroup.com/markets/interest-rates/cme-fedwatch-tool.html
- U.S. Bureau of Labor Statistics (BLS): October 2026 Consumer Price Index (CPI) and Producer Price Index (PPI) releases — https://www.bls.gov/cpi/
- SoSoValue ETF Tracker (Nov 2026): U.S. Spot Bitcoin ETF cumulative and daily net flow statistics — https://sosovalue.com/assets/etf/us-btc-spot
- Glassnode & CryptoQuant On-Chain Analytics (Nov 2026): 30-day stablecoin supply contraction (-$14.2B) and Binance Taker Buy/Sell Ratio (0.85) — https://studio.glassnode.com/ & https://cryptoquant.com/
- Binance Research (Nov 2026): Monthly institutional ETF flow breakdowns for Bitcoin and Ether — https://www.binance.com/en/research
Regulatory & Educational Disclosure
This article is published by ZenvestAI.com strictly for informational and educational purposes. In alignment with global regulatory standards including principles set forth by the International Organization of Securities Commissions (IOSCO), the U.S. Securities and Exchange Commission (SEC), and the European Union’s Markets in Crypto-Assets (MiCA) framework—this content does not constitute financial, investment, tax, or legal advice, nor does it represent an offer or solicitation to buy or sell any digital asset or security. Digital assets and equities carry substantial risk of capital loss; always conduct independent research and consult a licensed financial advisor before making investment decisions.