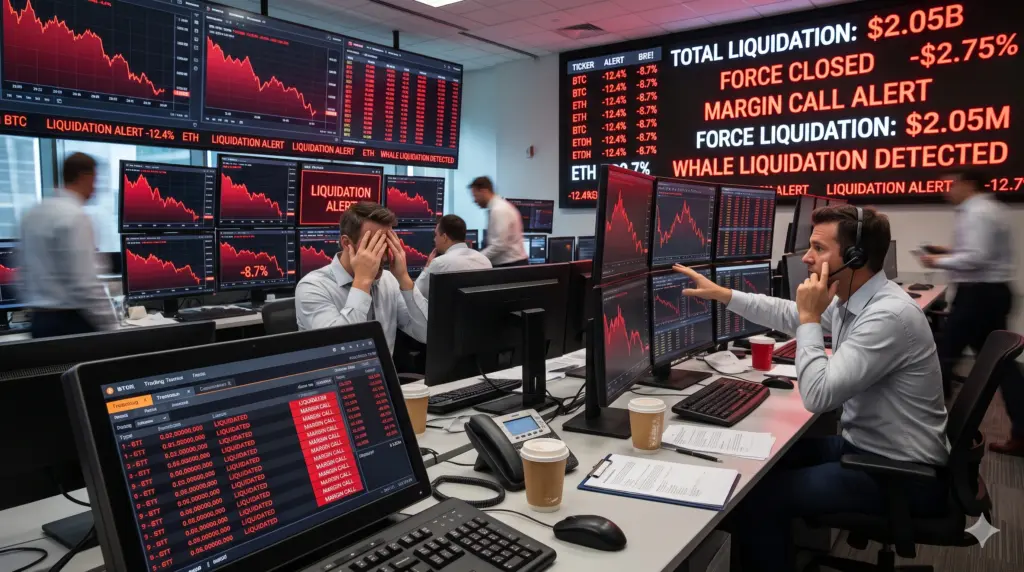
The latest crypto market selloff has triggered a major wave of forced liquidations, hitting leveraged traders across Bitcoin, Ethereum and other digital assets. Large trading positions, including those associated with whale accounts, have faced heavy losses as prices moved lower and liquidation levels were reached.
The pressure became particularly visible during November 2026. Bitcoin dropped below $70,000 on November 13, while Ethereum traded below $2,000. At the same time, crypto futures liquidations increased sharply, with billions of dollars in leveraged positions being closed across the wider market during the period. At the writing of this article Bitcoin Price is at $ 65,028.00 and Ethereum Price is at $1,821.16.
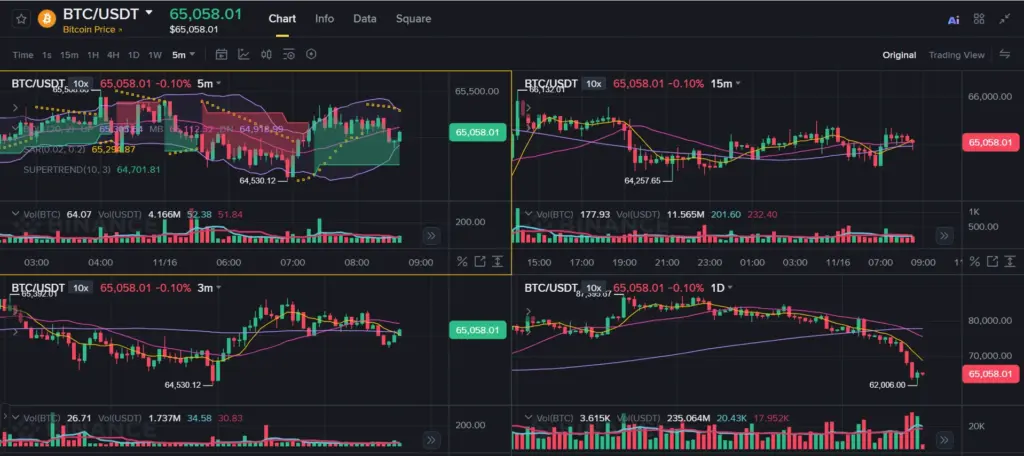
The important point is that this was not simply a decline in cryptocurrency prices. It was also a breakdown in leveraged market positioning. Traders who had borrowed exposure to bet on higher prices faced forced closures when their available margin could no longer support their positions.
Large traders were not protected from this process. Even a whale holding a position worth tens of millions of dollars can face liquidation when leverage is high and the market moves quickly.
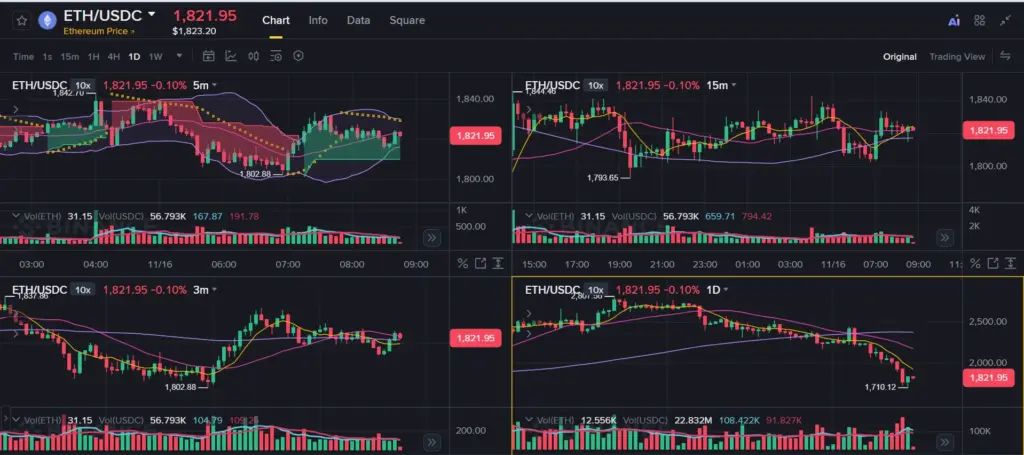
This article explains what triggered the selloff, how whale liquidations developed, why leveraged positions increased the pressure and what market participants should watch to understand whether selling pressure is easing.
Crypto Selloff Triggers Multiple Whale Liquidations: What Happened and Why Large Traders Were Forced to Exit
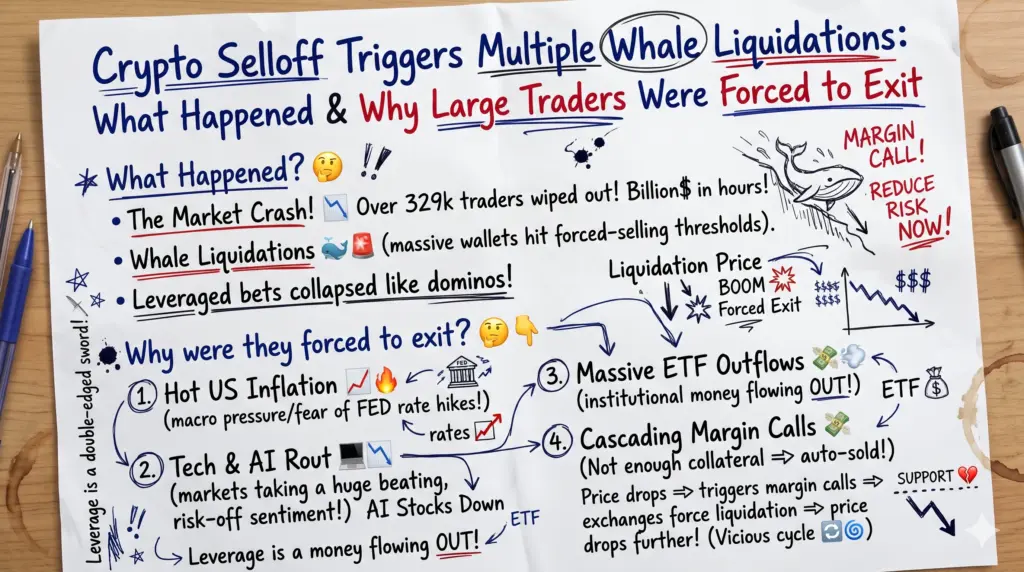
What This Article Covers
- What happened during the November 2026 crypto selloff.
- Why Bitcoin and Ethereum declines triggered forced liquidations.
- How large whale positions were affected.
- Why leveraged long positions can accelerate market declines.
- The relationship between open interest, funding rates and liquidations.
- What the liquidation figures reveal about market positioning.
- Which indicators can help identify whether selling pressure is continuing.
What Happened During the November 2026 Crypto Selloff?
The November selloff developed through a combination of falling cryptocurrency prices, weaker market positioning and increased pressure on leveraged traders.
On November 13, Bitcoin fell below $70,000, reaching its lowest level since August 19, according to CoinDesk’s market reporting. Ethereum also moved below $2,000, while several other major cryptocurrencies experienced additional losses.
The decline was accompanied by a sharp increase in derivatives liquidations.
CoinDesk reported that more than $1.3 billion in cryptocurrency futures positions were liquidated over a 24-hour period during the November 13 selloff. Bitcoin accounted for approximately $677 million of those liquidations in that report.
A separate CoinDesk market update covering the same period reported approximately $1.64 billion in 24-hour liquidations, with long positions representing 88.6% of the total.
These figures represent different reporting snapshots and time windows. They should not be added together as separate liquidation events.
The market pressure had also become visible earlier in November.
On November 9, The Block reported that total crypto liquidations had exceeded $1.15 billion over 24 hours. Approximately $1.04 billion came from long positions, while around $117 million came from short positions.
The data showed that traders expecting cryptocurrency prices to rise were facing the greatest immediate pressure.
The next question is why falling prices created such a large impact on leveraged positions.
Read It Also:- The Complete Ethereum Wealth Strategy
Why Falling Crypto Prices Triggered Forced Liquidations
A liquidation happens when an exchange automatically closes a trader’s leveraged position because the remaining margin is no longer sufficient to support the trade.
It is different from a normal market sale.
A trader holding Bitcoin in a spot wallet can generally continue holding the asset during a price decline. However, a trader using leverage has additional obligations because the position is supported by borrowed funds or margin.
Consider a simple example.
A trader opens a $100,000 Bitcoin long position using $10,000 of their own margin and 10x leverage.
The position is worth $100,000, but the trader has only contributed $10,000.
If Bitcoin falls by 5%, the position loses approximately $5,000 before fees and funding costs. That represents half of the trader’s initial margin.
If the market continues falling, the remaining margin can become insufficient, and the exchange may close the position.
The exact liquidation price depends on the exchange’s maintenance margin, fees, funding payments, collateral and position structure.
This is why a relatively small percentage decline in Bitcoin can create a much larger loss for a leveraged trader.
During a broad selloff, many traders can have similar positions and liquidation levels. When prices reach those levels, exchanges begin closing positions, creating additional market orders.
That process can increase selling pressure.
How Whale Liquidations Added to Market Pressure
Crypto whales are large holders or traders whose transactions can represent substantial amounts of market exposure.
In derivatives markets, a whale may control a position worth millions of dollars without owning the entire value of the position in cash.
This distinction is important.
A large leveraged position can become vulnerable when the market moves against it. If the position reaches its liquidation threshold, the exchange can close it automatically, regardless of the trader’s original market expectations.
Whale activity during the November decline illustrated this risk.
WhaleRadar’s November 15 incident tracking reported approximately $115 million in tracked whale liquidations on November 13 and another $203 million on November 14 on Hyperliquid. It reported that approximately 97% of the November 14 amount involved long positions.
The same tracking identified a liquidation cascade of approximately $109 million across 47 markets between 20:16 and 21:21 UTC on November 14.
These figures relate to tracked whale activity on Hyperliquid. They should not be interpreted as the total whale liquidations across all cryptocurrency exchanges.
The wider market figures were substantially larger.
The distinction matters because a large individual wallet liquidation and a market-wide liquidation total measure different things.
Nevertheless, the tracked activity shows how large leveraged positions can become exposed during a rapid decline.
Related article:- The Complete Bitcoin Wealth Strategy
Why Even Large Traders Can Lose Their Positions
A large trading account does not automatically have low liquidation risk.
The actual risk depends on several factors:
- Leverage: Higher leverage leaves less room for an adverse price movement.
- Collateral: A position with limited margin can become vulnerable quickly.
- Position size: Large positions can be difficult to close without affecting execution prices.
- Market liquidity: Thin order books can increase slippage during rapid selling.
- Volatility: Sudden price movements can push positions toward liquidation levels.
- Cross-margin exposure: Other positions and collateral values can affect the account’s available margin.
For example, a whale using 20x leverage has much less room for an adverse market move than a trader using 2x leverage, assuming comparable margin structures.
The important lesson is that account size alone does not determine survival during a market crash. Position structure and available collateral matter just as much.
How Whale Liquidations Can Create a Selling Cascade
A liquidation cascade occurs when forced position closures contribute to additional price movements, which then trigger more liquidations.
The process can develop in several stages.
Stage 1: Bitcoin starts declining
A negative market development, reduced buying demand or broader risk-off sentiment pushes Bitcoin lower.
Stage 2: Leveraged long positions approach liquidation levels
Traders who opened long positions using borrowed exposure begin experiencing increasing unrealised losses.
Stage 3: Exchanges close vulnerable positions
When the required margin is no longer available, exchanges automatically close positions.
Stage 4: Forced selling adds market pressure
Closing long positions can involve selling the underlying exposure or using equivalent derivatives-market execution mechanisms.
Stage 5: Additional liquidation levels are reached
If the extra selling pushes prices lower, other leveraged traders may also reach their liquidation thresholds.
Stage 6: The market experiences another wave of forced closures
The process can repeat until enough positions have been removed, buyers return or market conditions stabilise.
This is why a cryptocurrency market can sometimes fall much faster than the initial news or selling activity might suggest.
However, liquidation cascades do not happen during every market decline. Their intensity depends on leverage concentration, market depth, position distribution and available liquidity.
Read It:- What Is Crypto Futures Trading? A Complete Beginner’s Guide
Why Bitcoin’s Decline Also Affected Ethereum and Altcoins
Bitcoin remains an important reference point for the wider cryptocurrency market.
When Bitcoin experiences a sharp decline, traders often reassess their exposure to Ethereum and smaller digital assets.
This relationship can become stronger during periods of market stress.
Ethereum also experienced substantial liquidation pressure during November.
The Block reported that Ethereum traders accounted for more than $500 million in liquidations during the 24-hour period covered by its November 9 report. Bitcoin accounted for approximately $309 million in that same reporting window.
This demonstrates that liquidation pressure was not limited to Bitcoin.
Altcoins can face additional challenges because some have thinner trading liquidity and less market depth than Bitcoin or Ethereum.
When traders attempt to close large positions in these markets, the available buying demand may not be sufficient to absorb the selling without significant price movement.
As a result, smaller cryptocurrencies can experience sharper percentage declines even when their individual market developments are limited.
What Open Interest Reveals About the Liquidation Event
Open interest (OI) measures the total value of outstanding derivatives contracts that have not yet been closed or settled.
It helps analysts understand whether traders are adding exposure or reducing existing positions.
During the November 13 selloff, CoinDesk reported that crypto futures open interest fell 4.6% to approximately $120.2 billion over 24 hours, while futures trading volume increased 58.3% to approximately $269.1 billion.
This combination is important.
Trading volume increased, meaning derivatives market activity became much heavier. At the same time, open interest declined, indicating that outstanding positions were being reduced.
The market was experiencing substantial position turnover and forced closures.
However, open interest should not be interpreted in isolation.
A decline in OI can result from liquidations, voluntary position closures, expiry or other changes in outstanding contracts.
It does not independently identify how many traders were liquidated or whether institutional investors were buying or selling.
For a clearer interpretation, analysts compare open interest with price movement, funding rates and liquidation data.
What Funding Rates Say About Trader Positioning
Funding rates are periodic payments exchanged between traders holding long and short perpetual futures positions.
They help keep perpetual futures prices aligned with the underlying market.
A positive funding rate generally means long traders are paying short traders. A negative funding rate generally means short traders are paying long traders.
During the November 13 market update, CoinDesk reported that funding rates had turned moderately negative across several major cryptocurrencies, including Bitcoin, Ethereum, XRP and Solana.
This suggested that bearish derivatives positioning had become more prominent.
However, negative funding does not automatically mean that prices must continue falling.
It can also indicate that the market has become heavily positioned toward short exposure.
If buying demand returns and prices rise unexpectedly, heavily positioned short traders can face pressure to close their positions. This may produce short liquidations and add buying pressure.
Therefore, funding rates are useful for understanding positioning, not predicting market direction on their own.
The Role of Macroeconomic Pressure in the Crypto Selloff
Crypto liquidations explain how falling prices can accelerate. They do not necessarily explain what started the decline.
The November selloff also developed against a difficult macroeconomic background.
CoinDesk reported that the US Dollar Index moved above 103, reaching its highest level since April 2025 during the November 13 market pressure.
A stronger dollar can create difficulties for risk-sensitive assets, including cryptocurrencies, particularly when investors become more cautious about financial conditions.
Interest-rate expectations also influenced market sentiment. Concerns about a potentially tighter Federal Reserve policy increased pressure on assets that depend heavily on available market liquidity.
Geopolitical developments added another layer of uncertainty during the same period.
These factors provide context for the broader market decline. However, they should not be treated as proof that one specific macroeconomic event directly caused every whale liquidation.
The distinction between the initial market trigger and the subsequent liquidation mechanism is essential.
Macroeconomic developments can influence investor demand. Falling prices can then expose leveraged positions. Forced closures can amplify the move.
These are connected processes, but they are not the same event.
What Traders Should Monitor After a Major Liquidation Wave
A large liquidation event does not automatically confirm that a market bottom has formed.
It shows that leveraged exposure has been removed, but spot demand and broader market conditions still determine whether prices can recover.
Several indicators can help explain what happens next.
1. Bitcoin price stability
The first question is whether Bitcoin can establish a stable trading range after the sharp decline.
A temporary bounce is not enough to establish a recovery. Sustained price stability is more useful.
2. Open interest recovery
If prices stabilise while open interest remains lower, it may indicate that excessive leverage has been removed.
If open interest rises rapidly again without strong spot demand, the market may be rebuilding leveraged exposure.
3. Funding rates
Funding rates can show whether traders are again paying heavily to hold long positions or whether bearish positioning remains crowded.
Extremely positive funding during a weak price recovery can indicate renewed long-side risk.
4. Spot trading volume
Spot market activity helps determine whether buyers are entering through direct asset purchases rather than relying mainly on derivatives exposure.
5. Exchange liquidity
Market depth and bid-ask spreads help show whether large orders can be absorbed without creating excessive price movement.
6. ETF flows
For Bitcoin and Ethereum, spot ETF inflows and outflows can provide additional information about demand through regulated investment products.
These indicators should be evaluated together rather than treated as independent buy or sell signals.
Why Liquidation Figures Need Careful Interpretation
Liquidation data is useful, but it has limitations.
Different data providers may report different totals because they use different exchanges, collection methods and time windows.
Some exchanges provide limited public liquidation information, while others may publish incomplete or delayed data.
A liquidation heatmap also requires careful interpretation.
It generally estimates price levels where clusters of leveraged positions could be vulnerable. It does not guarantee that every position at a displayed level will be liquidated.
There is also a difference between a publicly tracked whale wallet and the complete financial position of a large trader.
A trader may hold exposure across multiple exchanges, wallets and financial instruments. A single public wallet cannot reveal the full position.
For these reasons, ZenvestAI considers liquidation figures alongside open interest, funding rates, price action and market liquidity.
The goal is to understand the market structure rather than make conclusions from one large number.
Frequently Asked Questions
What triggered the November 2026 crypto liquidation wave?
The liquidation wave developed during a sharp decline in cryptocurrency prices, combined with leveraged long exposure and weaker market sentiment. Macro concerns, including interest-rate expectations and dollar strength, formed part of the wider market background.
What is a whale liquidation in crypto?
A whale liquidation occurs when a large leveraged trading position is forcibly closed because its available margin is insufficient. It can involve millions of dollars in exposure, but the liquidation amount does not necessarily represent the trader’s original cash investment.
How much crypto was liquidated during the November selloff?
CoinDesk reported approximately $1.64 billion in crypto futures liquidations over 24 hours in its November 13 market update. The Block separately reported more than $1.15 billion in liquidations during the November 9 reporting period. These are different reporting windows.
Why do long liquidations increase selling pressure?
When leveraged long positions are closed, exchanges execute transactions to reduce or close the exposure. These transactions can add selling pressure, especially when many positions are liquidated within a short period.
Does a large liquidation event mean Bitcoin has reached its bottom?
No. Liquidations show that leveraged positions have been removed. They do not prove that spot demand has returned or that selling pressure has ended.
Can whales be liquidated even if they hold millions of dollars?
Yes. A large account can still face liquidation if it uses substantial leverage, has insufficient available collateral or experiences a rapid adverse price movement.
What is the difference between whale liquidations and total crypto liquidations?
Whale liquidations refer to forced closures involving identified large positions or tracked wallets. Total crypto liquidations cover reported forced closures across the exchanges and markets included by a data provider.
ZenvestAI View
The November 2026 selloff highlights an important feature of cryptocurrency derivatives markets: large positions do not always provide protection against market volatility.
The combination of falling prices, leveraged long exposure and forced position closures created additional pressure across Bitcoin, Ethereum and other digital assets.
The tracked Hyperliquid whale data also shows that large positions were exposed to the same market mechanics as smaller leveraged accounts.
However, it would be incorrect to assume that all whales were liquidated, that every large wallet was holding a long position or that the liquidation figures identify the full activity of institutional investors.
The more useful interpretation is that the market experienced a significant reduction in leveraged exposure.
For analysts, the next important question is whether market demand can absorb the remaining selling pressure without another major liquidation wave.
That answer requires more than watching Bitcoin’s price. Open interest, funding rates, spot volume, liquidity and ETF flows all provide additional evidence.
The Bottom Line On Crypto Selloff Triggers Multiple Whale Liquidations: What Happened and Why Large Traders Were Forced to Exit
The November 2026 crypto selloff demonstrated how quickly leveraged positions can become vulnerable when cryptocurrency prices fall.
Bitcoin’s decline below $70,000, Ethereum’s move below $2,000 and the resulting liquidation activity exposed the risks of crowded long positions.
Large traders were not immune. Tracked whale liquidations showed that substantial leveraged positions could also be forcibly closed during the decline.
The central lesson is simple: a crypto selloff can become more severe when falling prices trigger forced liquidations, but a liquidation wave alone does not confirm that the market has reached its bottom.
Understanding the relationship between price, leverage, open interest and liquidity is essential to interpreting what happens next.
Disclosure: This article is for educational and informational purposes only. It does not constitute investment, trading, legal or financial advice. Cryptocurrency markets, leveraged derivatives and liquidation events involve substantial risk. Market data may differ between providers because of reporting periods, exchange coverage and collection methods. Readers should verify live market figures independently before making financial decisions.
Sources from where data has been taken for writing this article.
- CoinDesk — Bitcoin falls below $70,000 as dollar surges and $1.6 billion is liquidated (November 13, 2026): https://www.coindesk.com/markets/2026/11/13/bitcoin-hits-12-week-low-as-dollar-rallies-on-interest-rate-outlook-liquidations-top-usd1-6-billion
- CoinDesk — Bitcoin dips below $70,000 as the selloff gathers pace (November 13, 2026): https://www.coindesk.com/markets/2026/11/13/bitcoin-dips-below-usd70-000-as-selloff-gathers-pace
- The Block — Bitcoin loses 50-week moving average as 24-hour crypto long liquidations top $1 billion (November 9, 2026): https://www.theblock.co/news/markets/2026-11-09-bitcoin-loses-50-week-moving-average-as-24-hour-crypto-long-liquidations-top-1-billion-436102
- WhaleRadar — The November crypto slide, 2026: https://whaleradar.com/events/crypto-slide-2026
- CoinGlass — Crypto derivatives market data: https://www.coinglass.com/
- The Block — Futures market data: https://www.theblock.co/data/futures