Have you ever tried to untangle a massive knot of old cables behind your desk? Staring at endless rows of transaction hashes, raw hex numbers, and gas timestamps on a traditional block explorer feels just as exhausting.
When an institutional fund or crypto whale distributes $50 million across twenty separate sub-wallets, a flat spreadsheet or linear block explorer will never reveal the true architecture of that capital. Raw data hides the forest behind a wall of digital trees, making on-chain tracking feel like an exercise in pure frustration.
Market participants intentionally fragment transfers to conceal token accumulation, disperse decentralized finance positions, or obfuscate exit liquidity. If you only look at one transaction hash at a time, you inevitably miss the circular connections binding these independent wallets together.
You end up guessing who is trading against whom, often falling victim to manufactured volume and hidden whale clusters. To truly understand capital flows, you must transform raw transaction records into an interconnected, visual picture.
ZenvestAI Quick Answer: Graphing Blockchain Connections Visually
Arkham Intelligencesolves this visualization dilemma by transforming raw blockchain ledgers into interactive, real-time node graphs.Through its Visualizer and Tracer engines, Arkham renders individual wallet addresses as circular nodes and transactions as directed connecting lines. Instead of deciphering lines of code, you interact with a live detective board where you can drag, drop, and expand relationships across multiple chains.
Powered by its proprietary artificial intelligence system called Ultra, Arkham matches anonymous hex strings with authenticated entity tags, turning mysterious transactions into clear, actionable market intelligence.
Why Visualizing Blockchain Movements Matters Right Now
The rapid maturity of decentralized finance and cross-chain bridging makes visual analytics indispensable for modern crypto participants.
Institutional market makers routinely route trades across multiple decentralized exchanges, liquidity pools, and bridging contracts within seconds.
Attempting to track these multi-hop transactions on traditional explorers requires opening dozens of browser tabs simultaneously, which quickly becomes unmanageable.
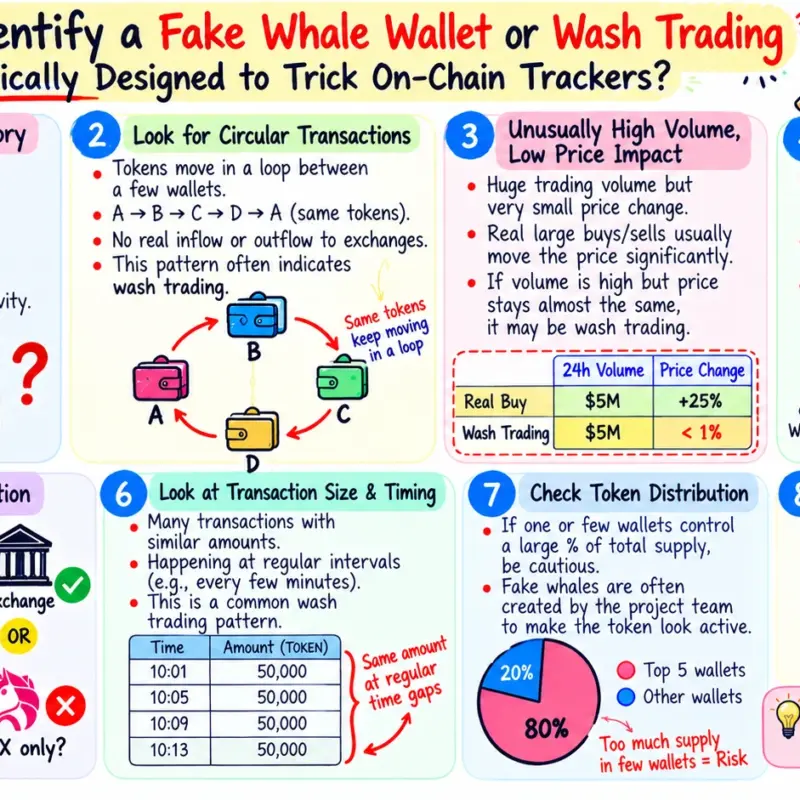
Visual graphing compresses hours of tedious on-chain forensic work into an intuitive snapshot. Within a few clicks, you can expose wash trading rings where developers trade tokens back and forth with themselves to fabricate activity.
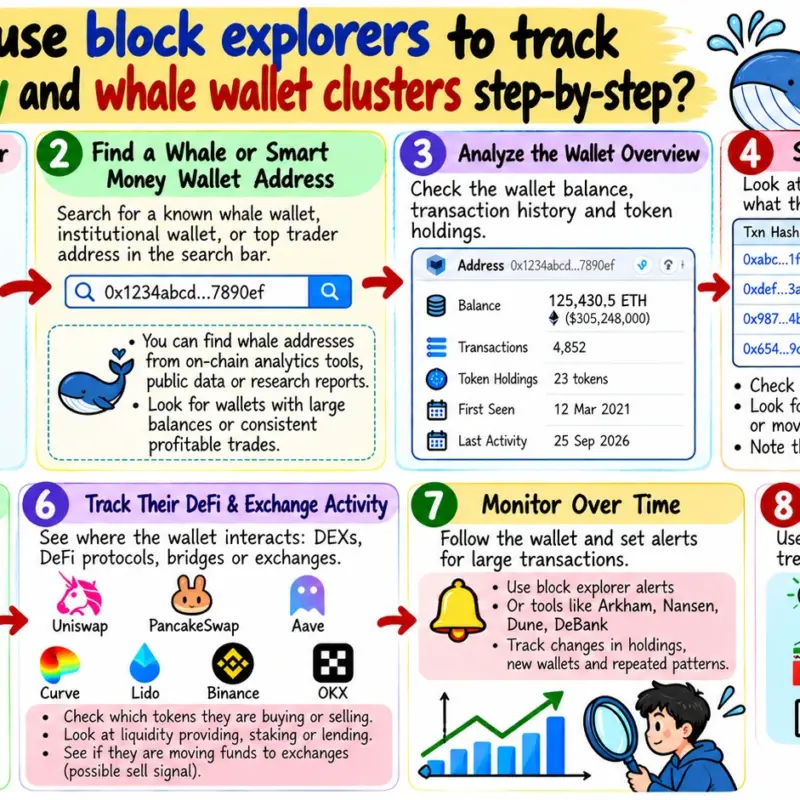
You can also spot when a long-dormant whale begins transferring substantial sums toward exchange deposit addresses. Seeing where money comes from and where it goes allows you to make informed decisions based on verifiable ledger data rather than social media chatter.
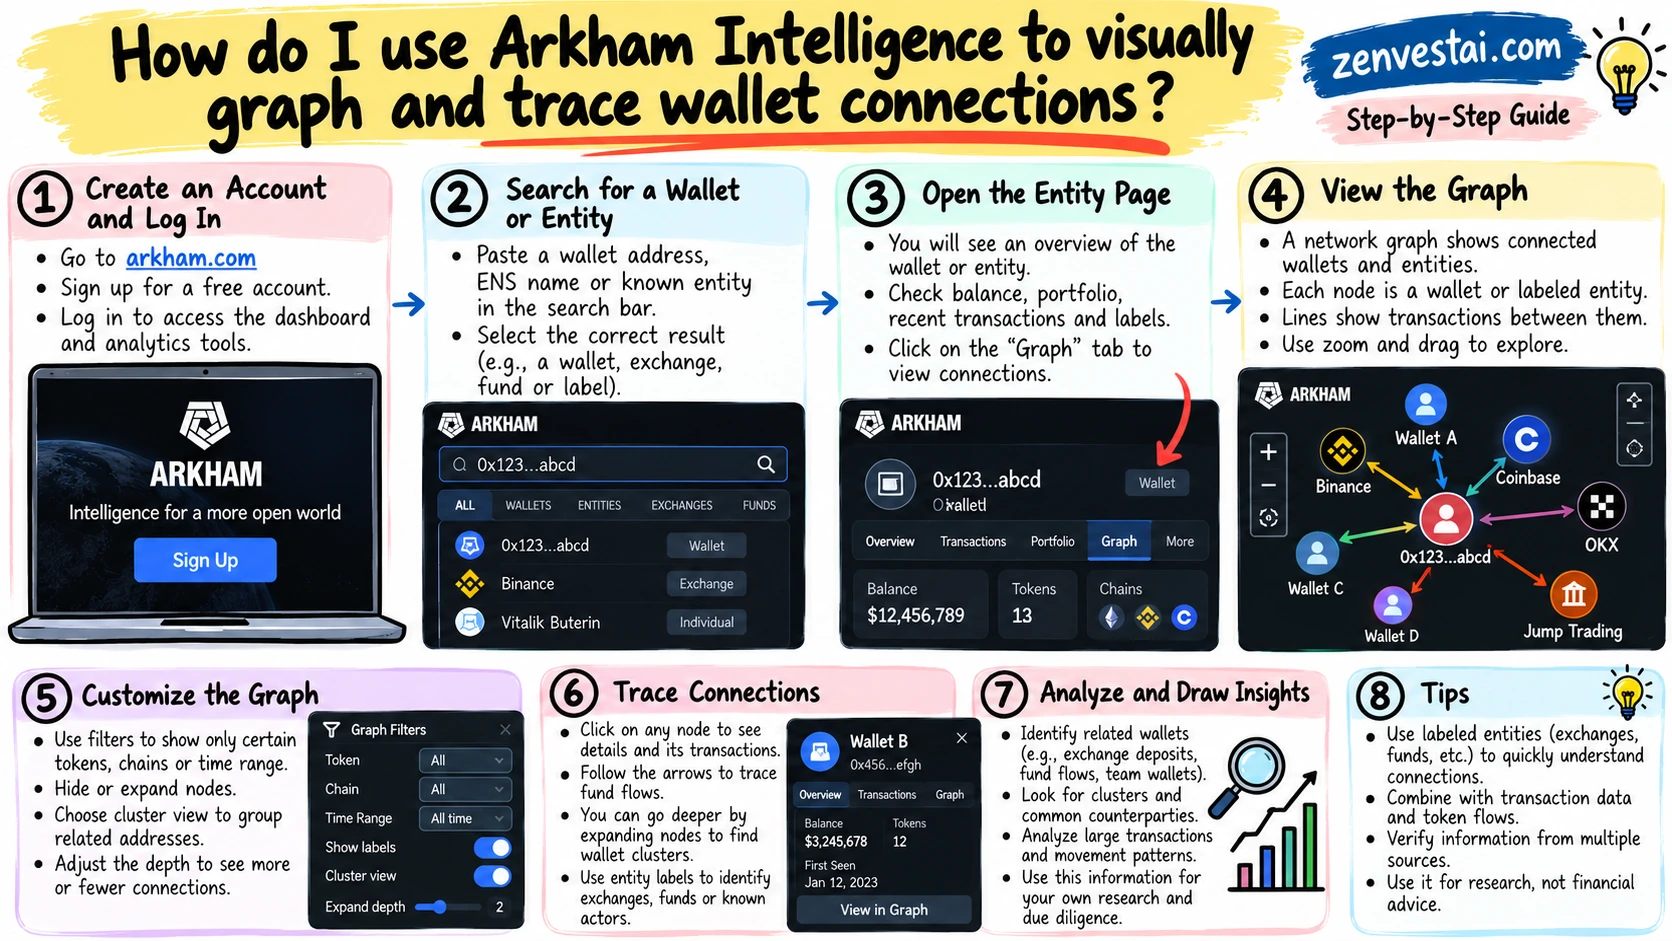
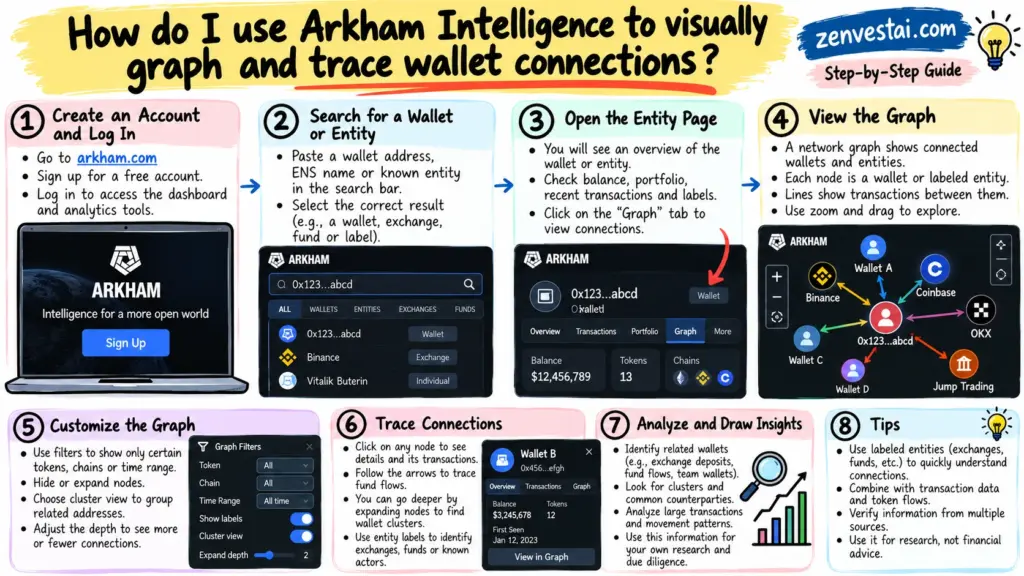
How do I use Arkham Intelligence to visually graph and trace wallet connections?
What You Need Before Investigating
Before opening your investigation canvas, ensure you have the basic tools ready:
1. A modern desktop web browser such as Chrome, Brave, or Firefox.
2. A registered, free user account on the Arkham Intelligence Platform.
3. A specific target identifier, which can be an Ethereum Virtual Machine address, a Solana address, a Bitcoin address, an ENS domain (like name.eth), or a known public entity (such as a venture capital fund, a decentralized protocol, or a centralized exchange).
How to Read Nodes, Edges, and Colors Of The Visual:
Reading an on-chain visual graph requires understanding Arkham’s core graphical syntax:
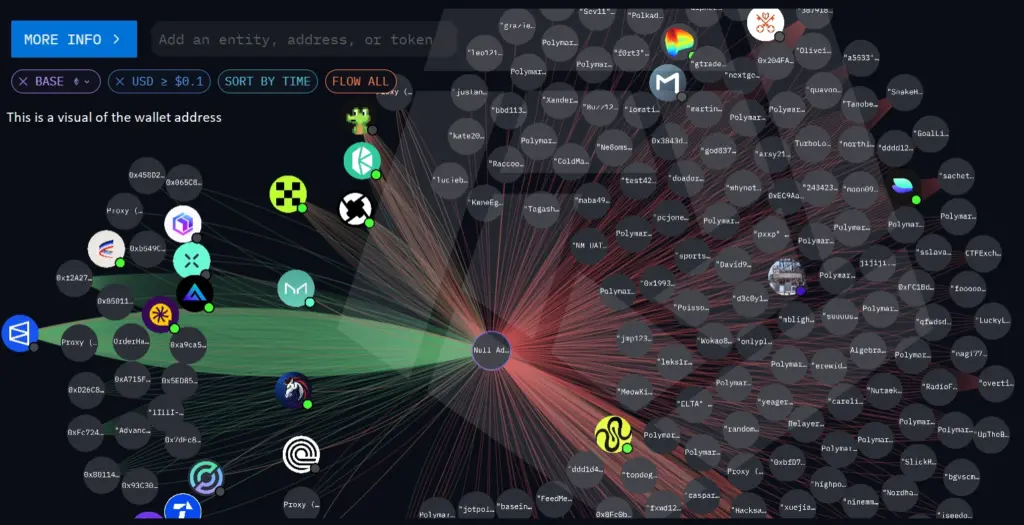
- Nodes (Circles): Every circle represents a unique on-chain participant, such as an individual private wallet, a smart contract, or an aggregated institutional entity.
- Edges (Connecting Lines): Every line represents an asset transfer between two nodes, with arrows indicating the direction of movement. Line thickness reflects the relative monetary value in USD.
- Green Lines: Indicate incoming asset inflows into your active target.
- Red Lines: Indicate outgoing asset outflows exiting your target.
- White Lines: Show internal transfers among multiple entities that you have added to your custom search canvas.
- Entity Border Colors: Colored rings around nodes classify the entity type, such as yellow for centralized exchanges, purple for decentralized finance protocols, and blue for private funds.
With this visual data reader in hand, let us walk through the exact steps to map your first wallet cluster.
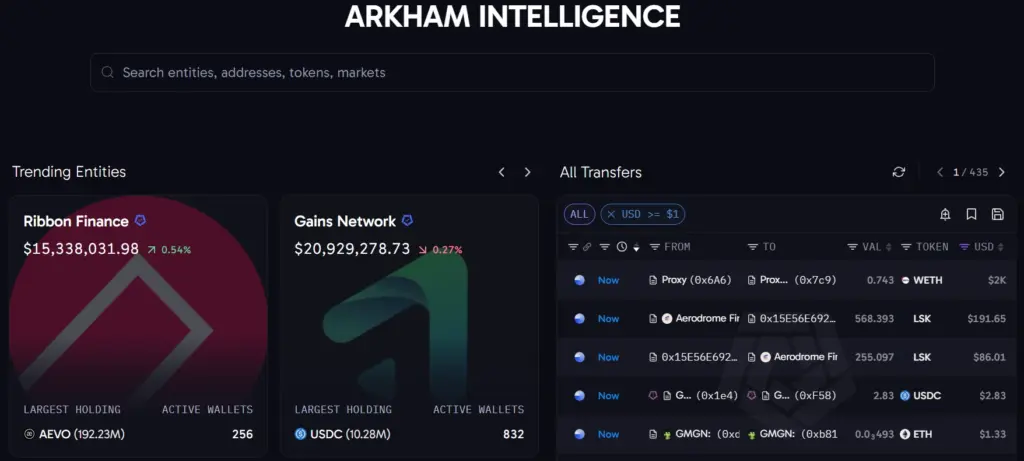
Step 1: Launch the Arkham Visualizer and Set Your Target
Every forensic investigation begins by placing your primary subject in the center of the canvas.
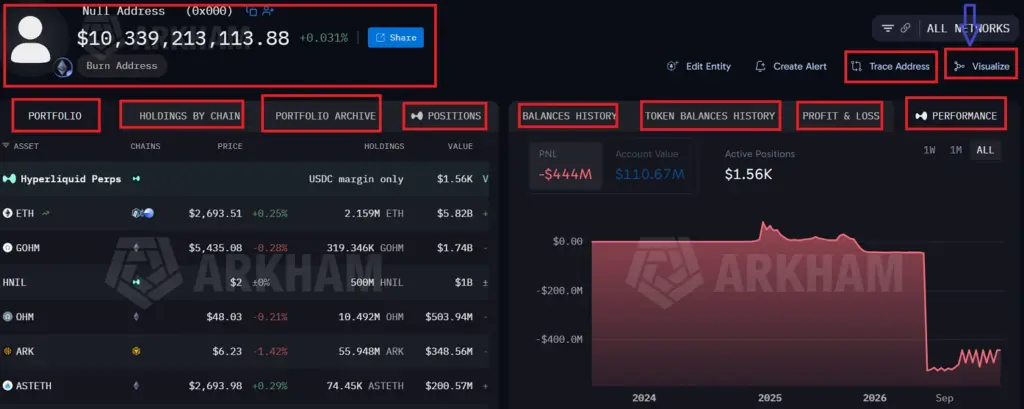
What should You do now? Navigate to the main navigation bar on Arkham and select the Visualizer tab, or paste your target wallet address directly into the top search bar. Once the target profile loads, click the visual graph icon located at the top right of the transaction panel. The platform will automatically query the blockchain ledger, pulling up to the 1,000 most recent transactions and plotting them as an interconnected web centered around your target node.
Step 2: Filter Out On-Chain Dust and Transaction Noise
An unfiltered visual graph frequently looks like an impenetrable spiderweb because it plots every automated airdrop, micro-gas refund, and spam token.
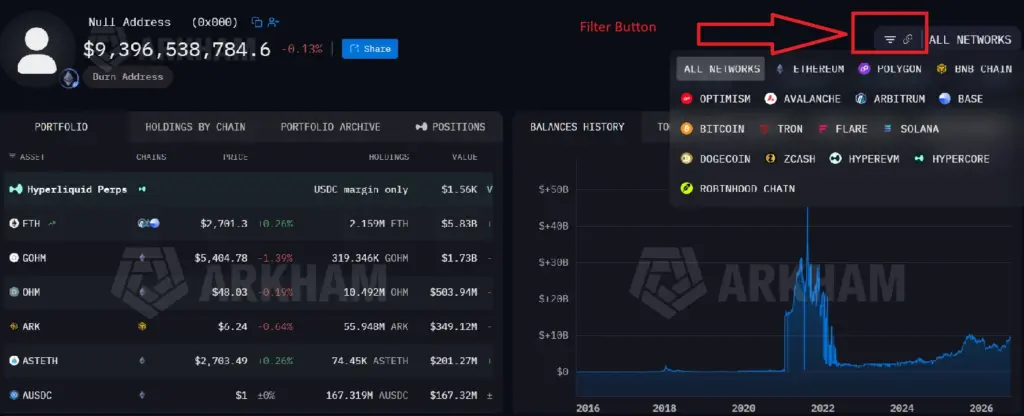
What should You do now? Open the Filter Panel by clicking More Info in the upper left corner of the screen. Locate the Value Filter and set the minimum threshold to $10,000 USD (or a higher amount appropriate for institutional research), then narrow your historical timeframe to the last 30 or 90 days. Click Apply. You will immediately see hundreds of insignificant transaction threads vanish, leaving only substantial, market-moving transfers visible on your screen.
Step 3: Trace the Flow and Direction of Capital
Determining whether your target entity is accumulating assets or preparing to sell depends entirely on directional movement.
What should You do now? Examine the arrows running along the connecting lines linked to your central node. Follow outward-pointing red lines to see where the entity is sending funds. If thick red edges terminate at yellow exchange nodes like Binance, Coinbase, or Kraken, the entity is routing liquid capital to an off-ramp, which often signals sell-side intent. Conversely, thick green lines originating from exchange hot wallets indicate accumulation into cold storage.
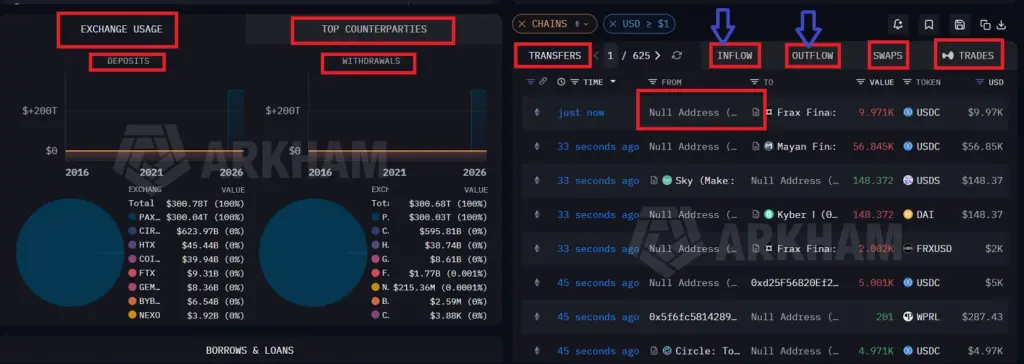
Step 4: Expand Unknown Wallets and Reveal Hidden Clusters
The true detective work begins when capital moves through intermediate, unlabeled wallets before reaching its final destination.
What should You do now? Identify any prominent gray nodes representing unlabeled private addresses that have exchanged significant volume with your target. Right-click that gray circle (or press the E key on your keyboard to enable the expansion cursor) and choose Expand Node. Arkham will query that secondary wallet’s transaction history and populate its counterparties on your screen. If this secondary wallet routes capital back to the original entity’s known addresses, you have visually mapped a private wallet cluster managed by the same operator.
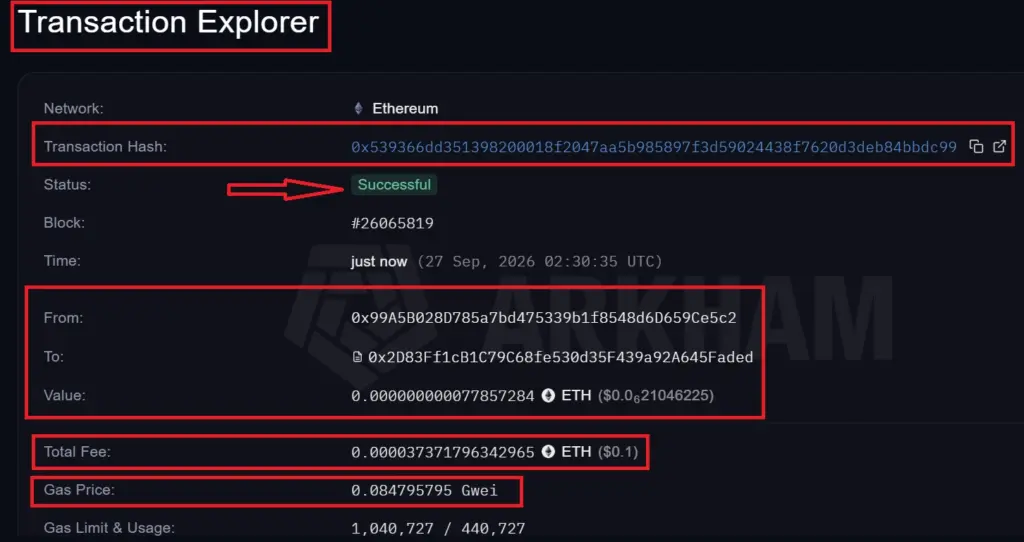
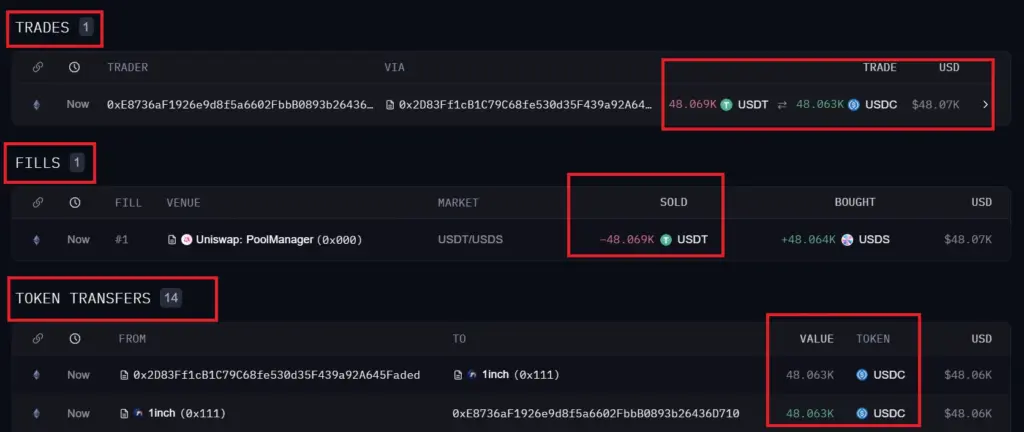
Step 5: Switch to Arkham Tracer for Multi-Hop Forensic Sleuthing
While the Visualizer maps wide ecosystems, tracking stolen funds or complex multi-hop fund movements requires a linear, chronological approach.
What should you do now? Click the Arkham Tracer Tool in the top menu to open a clean timeline canvas. Paste your primary wallet address into the left sidebar, then click the Outflow tab to review top counterparties chronologically. Click the green plus icon (+) beside a counterparty to add it as the next link in your timeline. Whenever you add a downstream recipient, click the Fetch Flows prompt to query that specific segment. This allows you to track cross-chain transfers systematically across Bitcoin, Ethereum, and major Layer-2 networks without visual clutter.
Arkham Visualizer vs. Arkham Tracer: Which Tool Should You Pick?

Selecting the proper investigative tool depends on your analytical goals:
| Feature | Arkham Visualizer | Arkham Tracer |
| Primary Purpose | Broad ecosystem mapping and entity discovery | Sequential, multi-hop forensic fund tracking |
| Visual Structure | Multi-directional spiderweb node cluster | Chronological, multi-stage linear timeline |
| Data Capacity | Up to 1,000 recent transactions automatically | Step-by-step expansion via manual flow queries |
| Cross-Chain Flow | Displays interactions on an open canvas | Deep-dive tracking across disparate blockchains |
| Best Used For | Uncovering shared counterparties and clusters | Investigating protocol exploits and off-ramps |
Security and Safety: Avoiding Poisoned Traps and Wash Trading
Visualizing on-chain data does not automatically protect you from deceptive on-chain tactics. Scammers routinely practice address poisoning, generating vanity addresses that closely mimic legitimate counterparts and sending zero-value transactions to high-profile wallets. These fraudulent transfers appear as connecting edges in the Visualizer. Always hover directly over connecting lines to inspect transaction amounts and verified contract signatures before assuming a real relationship exists.
Similarly, watch out for synthetic volume loops. Dishonest project teams often pass tokens between three or four private wallets in a circle to mimic active trading. In the Visualizer, this activity manifests as a circular ring of edges with balanced inflows and outflows. Recognizing this circular pattern prevents you from falling into manufactured liquidity traps.
Platform Costs: What Does It Cost to Trace On-Chain?
Access to both the Arkham Visualizer and the Arkham Tracer is completely free for individual researchers and retail analysts. Users simply register an account to build, configure, and save custom graphs without upfront subscription fees. While Arkham provides commercial API access for high-frequency institutional data demands, the web interface delivers comprehensive investigative capabilities without requiring paid upgrades.
Common Mistakes That Crash Your Browser and Cloud Your Analysis
The most frequent misstep among beginning analysts is expanding high-volume institutional nodes indiscriminately. Clicking Expand on a major exchange hot wallet or an active Uniswap routing contract prompts the system to load tens of thousands of active counterparties simultaneously. This surge in data can freeze your browser tab and turn your workspace into an unreadable visual tangle. Keep your canvas manageable by only expanding private, targeted wallets.
Another standard error is ignoring token contract addresses. When tracking a newly issued asset, double-check that the token flowing along the edges corresponds to the legitimate contract rather than a worthless clone with an identical ticker symbol.
Troubleshooting: What to Do When Graphs Look Overwhelming
If your graph remains dense and chaotic despite applying standard USD thresholds, your target wallet likely participates in multi-token algorithmic trading.
What should You do now? Navigate back to the filter panel and activate the Token Filter. Type the exact asset ticker you wish to investigate (such as ETH, USDC, or SOL) and deselect all others. The visual canvas will immediately hide unrelated transactions, allowing you to trace the flow of that specific asset cleanly.
Alternative Methods: When to Consider Bubblemaps
If you require a specialized alternative or Arkham experiences temporary maintenance, Bubblemaps offers a strong alternative for wallet analysis. Bubblemaps focuses on analyzing token distribution across top holders, displaying the top 100 holders of any token as floating bubbles where size corresponds to total supply held. While Bubblemaps does not provide the deep, multi-hop chronological tracing found in the Arkham Tracer, its interface makes identifying initial insider supply concentration fast and straightforward.
Frequently Asked Questions
What does Arkham Intelligence do?
Arkham Intelligence is a blockchain analytics platform that helps users investigate crypto transactions, wallets, entities, and on-chain activity. It links blockchain addresses to known entities where possible, making raw blockchain data easier to understand and analyze.
How do you use Arkham?
You can use Arkham by searching for a wallet address, token, transaction, or known entity. Its interface can help you explore wallet balances, transaction history, fund flows, and relationships between blockchain addresses. It is useful for on-chain research, whale tracking, and investigating crypto activity.
How does Arkham track crypto?
Arkham analyzes publicly available blockchain data and uses its entity-labeling system to connect blockchain addresses with known individuals, companies, exchanges, funds, and other entities. This turns individual on-chain transactions into a more understandable picture of crypto fund flows.
What is the current price of Arkham Intelligence (ARKM)?
ARKM’s price changes continuously with the crypto market. At the time of checking, 1 ARKM was around ₹12.93, according to CoinGecko. Because crypto prices can change within seconds, check a live market-data source before making any trading decision.
Is ARKM coin a good investment?
There is no objective answer to whether ARKM is a “good” investment. ARKM is the token associated with the Arkham ecosystem, but its price can be highly volatile. Before considering it, investors should examine factors such as token supply and unlocks, adoption of Arkham’s products, trading activity, competition, market conditions, and their own risk tolerance.
Who owns Arkham crypto?
Arkham Intelligence is the company behind the Arkham platform and ARKM token. It is a venture-backed blockchain analytics company rather than a cryptocurrency “owned” by one individual. ARKM tokens are held by various participants, including users, investors, and other market participants.
Is ARKM an AI coin?
ARKM is sometimes grouped with AI-related crypto assets, but Arkham is primarily known as a blockchain intelligence and analytics platform. The “AI coin” label can therefore be misleading if it suggests that ARKM is simply an AI-project token.
Who is the richest crypto owner?
There is no single reliable answer because private crypto holdings are difficult to verify, and wallet ownership can change. Public estimates often focus on people such as major crypto founders or large holders, but estimates of their total crypto wealth can vary significantly.
Which crypto does Elon Musk own?
Elon Musk has publicly said that he owns Bitcoin, Ethereum, and Dogecoin, although he has also indicated that his holdings are relatively small compared with his overall wealth. His companies’ crypto holdings and his personal holdings should not be treated as the same thing.
The ZenvestAI View
At ZenvestAI, we consider visual on-chain graphing to be one of the most effective ways to transition from speculative guessing to evidence-based analysis. Staring at raw block explorer hashes often leads to fatigue and missed details. By organizing transactions into visual relationships, you transform complex mathematical records into clear behavioral maps. Visual literacy empowers everyday investors to track smart money moves, identify distribution patterns, and sidestep deceptive marketing narratives.
The Bottom Line How do I use Arkham Intelligence to visually graph and trace wallet connections?
Blockchain ledgers are open to the public, but raw data is not readable by default. By leveraging Arkham’s Visualizer and Tracer, you replace confusing rows of code with an intuitive forensic map, allowing you to uncover real wallet ownership, track institutional capital, and navigate the market with verifiable clarity.
Related Intelligence
To deepen your on-chain research capabilities, explore our practical analyses covering:
- Identifying smart money accumulation patterns across decentralized exchanges.
- Step-by-step methods for verifying token contract source code on block explorers.
- Distinguishing between organic automated market maker volume and artificial wash trading.
Author and Editorial Information
Written by: The ZenvestAI On-Chain Research Desk
Published: September 2026 | Educational Edition
ZenvestAI publishes independent, evidence-grounded research designed to explain complex blockchain systems in clear, human language.
Regulatory and Educational Disclosure
This publication is prepared exclusively for informational, educational, and analytical purposes under global financial education standards (including principles established by the US SEC, EU MiCA guidelines, and IOSCO). This content does not constitute financial, investment, legal, tax, or trading advice. Cryptographic asset tracking involves technical interpretation of public records, which may carry inherent uncertainties. Always conduct your own independent research and consult licensed financial professionals before making capital commitments.