Crypto markets can move in minutes. But the blockchain keeps a much slower and more honest record: what actually happened on the network.
Prices tell you what the market is paying now. On-chain metrics tell you what users, holders, wallets and coins are doing underneath that price.
That difference matters.
A Bitcoin chart may show a sharp rally, but on-chain data can help you ask a deeper question: Is network activity supporting the move, or is price moving faster than the underlying blockchain activity?
Table of Contents
- On-Chain Metrics Explained: The Blockchain Data Analysts Actually Use
- What You Will Learn
- ZenvestAI Explains: What Are On-Chain Metrics?
- Network Activity Metrics: Is the Blockchain Actually Being Used?
- Supply and Holder Metrics: Who Holds the Supply?
- Exchange Flow Metrics: Where Is the Crypto Going?
- Profit and Loss Metrics: Are Holders Sitting on Gains or Losses?
- Valuation and Network-Usage Metrics: Is the Network Being Valued Against Its Activity?
- A Map of the Major On-Chain Metrics
- What On-Chain Data Can—and Cannot—Tell You
- Common Mistakes Beginners Make
- The ZenvestAI View
- FAQ
- Author & Editorial Information
On-Chain Metrics Explained: The Blockchain Data Analysts Actually Use
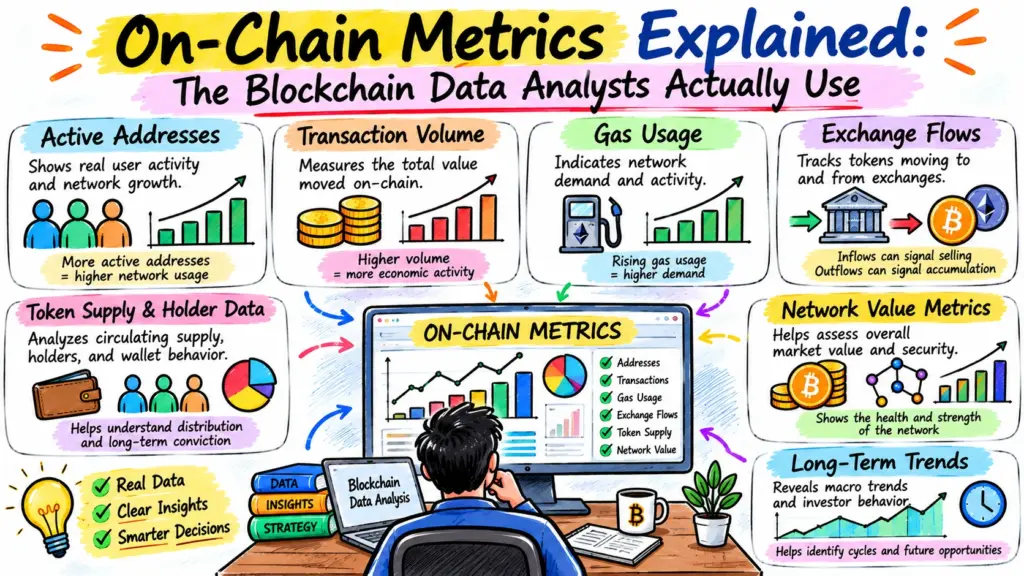
This article explains the main on-chain metrics analysts use to study network activity, supply, exchange flows, holder behavior, profitability and valuation. The goal is not to turn you into a data scientist. It is to help you understand what each metric is actually measuring and, equally important, what it is not telling you.
The important idea is simple: no single metric tells the whole story. Good on-chain analysis connects several measurements before reaching a conclusion.
ZenvestAI Explains: What Are On-Chain Metrics?
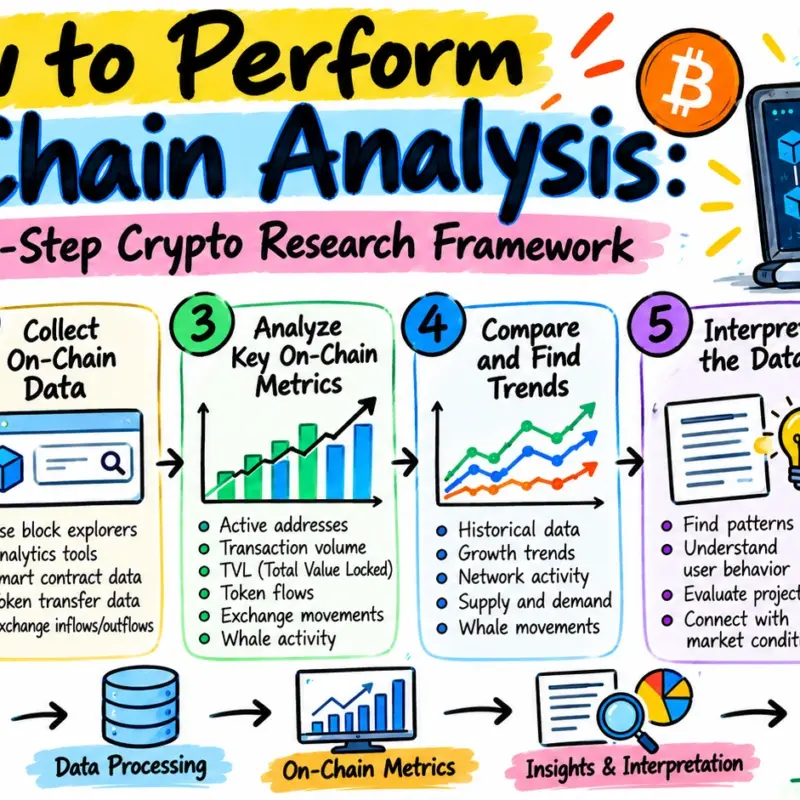
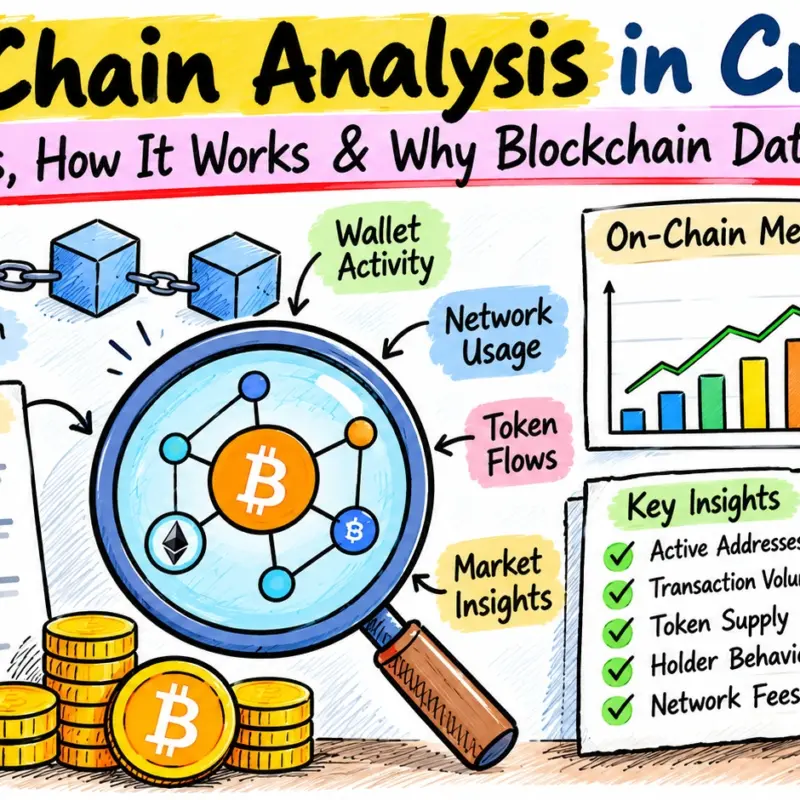
On-chain metrics are measurements created from data recorded directly on a blockchain. Blockchains record transactions, addresses, balances, coin movements, fees and other network activity. Analysts can process this public ledger data to create indicators that describe how a crypto network is being used and how its supply is moving.
For example, active addresses can show how many addresses participated in successful transactions during a period. Glassnode defines its Bitcoin Active Addresses metric as unique addresses active as a sender or receiver. But there is an important catch. One address is not necessarily one person. A single individual can control several wallets.
An exchange can control thousands or millions of addresses. Smart contracts can also generate large amounts of activity. So on-chain analysis is best viewed as behavioral evidence from the blockchain, not a perfect database of human identities. That distinction becomes important as we move into the individual metrics.
Network Activity Metrics: Is the Blockchain Actually Being Used?
Network activity metrics answer the first question an analyst should ask:
Is there meaningful activity happening on the network?
Active Addresses
Active addresses measure addresses that participate in transactions during a selected period.
If active addresses rise, it can indicate increased network participation. If they fall, activity may be cooling.
However, analysts should not automatically interpret rising addresses as rising adoption. Airdrops, bots, exchange operations, smart-contract activity and other automated behavior can increase address counts without representing an equivalent increase in individual users.
Next question: If more addresses are active, how much value are they actually moving?
Transaction Count
Transaction count measures the number of transactions recorded during a period.
It helps analysts understand the amount of transaction activity taking place on a blockchain.
But transaction count alone can be misleading. Thousands of small transactions can produce a high count without moving much economic value.
That leads naturally to the next metric.
Transaction Volume
Transaction volume measures the value transferred on-chain during a given period.
It helps answer:
How much value is moving?
Volume can add context to transaction counts. A network with 500,000 transactions may look very different if the transferred value is relatively small compared with a network processing fewer but much larger transfers.
Analysts therefore often examine transaction count and transaction volume together.
Network Fees
Network fees show how much users are paying to have transactions processed.
Fees can provide information about demand for blockchain block space. Higher demand can push fees upward, although the exact mechanism differs across networks.
On Ethereum, for example, transaction fees are based on gas used and the applicable fee structure. Ethereum’s documentation explains that gas measures computational work and that the fee includes a base fee and, where applicable, a priority fee.
Gas Usage
Gas usage is especially important on smart-contract networks such as Ethereum.
Gas measures computational work rather than simply the number of transactions. A basic ETH transfer requires less computation than a complex smart-contract interaction. Ethereum currently explains gas as the unit used to measure computational effort required to execute operations.
This creates an important analytical distinction:
More transactions do not always mean more computational demand.
A smaller number of complex transactions can consume substantial gas.
Supply and Holder Metrics: Who Holds the Supply?
Once you understand network activity, the next question becomes more interesting:
Who holds the coins, and how is that supply moving?
Holder Distribution
Holder distribution examines how supply is spread across addresses or wallet groups.
Analysts may examine small holders, medium-sized holders and large holders to understand the concentration of supply.
Whale Holdings
Whale holdings track large holders or wallet clusters containing significant amounts of an asset.
Whale activity can matter because a large transfer may have a greater potential market impact than a small wallet movement.
But wallet labels require care. One address may belong to an exchange, custodian or institutional service rather than an individual investor.
Long-Term and Short-Term Holders
Long-term holders generally represent coins that have remained inactive for longer periods, while short-term holders represent coins that have moved more recently.
These classifications vary by data provider and asset.
The key analytical idea is coin age: how long a particular unit of supply has remained dormant before being spent or transferred.
Dormant Supply
Dormant supply refers to coins that have not moved for a defined period.
Large amounts of dormant supply can tell analysts that a portion of the circulating supply has remained inactive.
But dormant does not mean permanently lost. A coin that has been untouched for years can still move tomorrow.
HODL Waves
HODL Waves visualize the distribution of supply according to coin age.
Instead of asking only how many coins exist?, the analyst asks:
How long have those coins remained where they are?
This makes HODL Waves useful for studying changes in holder behavior and the movement of older versus newer supply.
Exchange Flow Metrics: Where Is the Crypto Going?
Exchange data is one of the most watched areas of on-chain analysis because centralized exchanges remain important places for trading and liquidity.
Glassnode notes that exchange metrics commonly include exchange balances, inflow and outflow volumes, and deposits or withdrawals. It also highlights an important limitation: exchange wallet identification depends on address labeling and clustering, and those classifications can change.
Exchange Inflows
An exchange inflow measures crypto moving into addresses identified as belonging to exchanges.
This can indicate that more coins are becoming available within exchange-controlled wallets.
But here is the mistake beginners often make:
An exchange inflow does not automatically mean that coins are being sold.
Coins can move for custody changes, internal wallet management, collateral requirements, or other operational reasons.
Exchange Outflows
Exchange outflows measure crypto moving away from identified exchange addresses.
Outflows may reduce the amount of coins held in exchange wallets, but they do not automatically prove that investors are moving coins into long-term cold storage.
Exchange Netflow
Exchange netflow generally compares inflows with outflows.
A simple interpretation is:
Netflow = Inflows − Outflows
A positive value means inflows exceed outflows during the measured period. A negative value means outflows exceed inflows.
The important point is that direction provides context, not a guaranteed price signal.
Exchange Balances
Exchange balances track the amount of an asset held by identified exchange wallets.
This metric can help analysts study changes in the readily observable exchange-held supply.
However, exchange labels are estimates created through address attribution. That makes data quality and methodology important when comparing providers.
Profit and Loss Metrics: Are Holders Sitting on Gains or Losses?
The next layer asks something price charts cannot directly show:
What is the economic position of existing holders?
Realized Capitalization
Realized capitalization values coins based on the price associated with their most recent on-chain movement rather than simply assigning the current market price to every coin.
This makes realized cap different from traditional market capitalization.
Realized Price
Realized price is commonly derived by dividing realized capitalization by the relevant circulating supply.
It provides a way to think about the aggregate cost basis represented in the realized-cap framework.
MVRV
MVRV, or Market Value to Realized Value, compares market value with realized value.
Conceptually:
MVRV = Market Value ÷ Realized Value
A higher MVRV indicates that market value is larger relative to realized value. A lower MVRV indicates a smaller difference.
MVRV is often used to study valuation extremes, but its meaning depends on the asset, historical regime and methodology.
SOPR
SOPR, or Spent Output Profit Ratio, examines the profit or loss associated with coins when they are spent.
It helps answer:
Are coins moving on-chain at a profit or at a loss relative to their previous movement?
SOPR is therefore a behavioral metric rather than simply a price indicator.
NUPL
NUPL, or Net Unrealized Profit/Loss, estimates the aggregate unrealized profit or loss embedded in the supply.
It asks whether the network’s holders, in aggregate, are sitting on unrealized gains or losses.
These metrics become much more useful when viewed together rather than treated as isolated buy-or-sell signals.
Valuation and Network-Usage Metrics: Is the Network Being Valued Against Its Activity?
The final major group connects blockchain activity with market value.
NVT
NVT, or Network Value to Transactions, compares a network’s value with transaction activity.
Conceptually:
NVT = Network Value ÷ Transaction Activity
The metric attempts to place market valuation in the context of blockchain settlement activity.
A high NVT can indicate that network value is large relative to measured transaction activity. A low NVT indicates the opposite.
However, transaction activity can be affected by the design of the blockchain, internal transfers, stablecoins, batching and other factors. NVT therefore requires context.
Network Value
Network value generally refers to the market value assigned to the crypto asset, commonly represented through market capitalization.
The important analytical step is not simply observing network value. It is comparing that value with real usage, supply behavior and economic activity.
That is where on-chain analysis becomes more powerful.
A Map of the Major On-Chain Metrics
| Metric | Main Question |
|---|---|
| Active Addresses | Is network activity changing? |
| Transaction Count | How many transactions are occurring? |
| Transaction Volume | How much value is moving? |
| Network Fees | How much are users paying for block space? |
| Gas Usage | How much computation is the network processing? |
| Holder Distribution | How is supply distributed? |
| Whale Holdings | How much supply is concentrated among large holders? |
| Dormant Supply | How much supply has remained inactive? |
| HODL Waves | How is supply distributed by age? |
| Exchange Netflow | Is crypto moving toward or away from exchanges? |
| Exchange Balance | How much crypto is held by identified exchanges? |
| Realized Capitalization | What value is assigned using previous on-chain movement prices? |
| Realized Price | What does realized value imply about aggregate cost basis? |
| MVRV | How does market value compare with realized value? |
| SOPR | Are spent coins realizing profit or loss? |
| NUPL | Are holders collectively in unrealized profit or loss? |
| NVT | How does network value compare with transaction activity? |
What On-Chain Data Can—and Cannot—Tell You
The biggest mistake in on-chain analysis is treating one metric as a prediction machine.
On-chain metrics are evidence, not certainty.
Active addresses can rise because of genuine adoption or automated activity. Exchange inflows can precede selling, but they can also reflect operational transfers. Whale movements can attract attention without producing a meaningful price change.
The strongest analysis therefore combines several layers:
Network activity + supply behavior + exchange flows + profit/loss + valuation.
This produces a much clearer picture than watching a single dashboard indicator.
Common Mistakes Beginners Make
Mistake 1: Treating every exchange inflow as selling.
An inflow shows movement to an exchange-controlled address—not the final trading action.
Mistake 2: Treating addresses as people.
Wallet infrastructure makes one-to-one user counting unreliable.
Mistake 3: Reading transaction count without transaction value.
High transaction activity does not automatically mean high economic value transfer.
Mistake 4: Using MVRV, SOPR or NUPL as standalone signals.
These metrics need historical and market context.
Mistake 5: Ignoring methodology.
Different providers can use different address labels, entity clustering and calculation methods.
The ZenvestAI View
The most useful way to approach on-chain analysis is to think in questions rather than indicators.
Instead of asking, “Is MVRV bullish?”, ask:
What is happening to network activity?
Then:
Who is holding the supply?
Then:
Where is the supply moving?
Then:
Are holders realizing profits or losses?
And finally:
Does the network’s market value make sense relative to its measured activity?
This question-first approach reduces the temptation to treat a single metric as a market oracle.
It also creates a better foundation for advanced on-chain research, where metrics such as MVRV Z-Score, SOPR variants, realized-cap bands, entity-adjusted flows and supply-age analysis can be studied in greater detail.
The Bottom Line On-Chain Metrics Explained: The Blockchain Data Analysts Actually Use
On-chain analysis is the study of blockchain behavior through measurable ledger data.
Active addresses tell you about participation. Transaction volume shows value movement. Holder and age metrics reveal supply behavior. Exchange flows show where coins are moving. MVRV, SOPR and NUPL examine profit and loss. NVT connects network value with transaction activity.
The real skill is not memorizing every metric.
It is learning which question each metric answers—and which question it cannot answer.
These concepts should be studied together because blockchain data becomes much more useful when multiple measurements tell the same story—or expose a contradiction.
FAQ
Are on-chain metrics only useful for Bitcoin?
No. On-chain analysis can be applied to many blockchain networks. However, the available metrics differ by chain architecture, transaction model and data availability. But it still remains extremely useful for Bitcoin.
Are active addresses equal to the number of crypto users?
No. One person can control multiple addresses, while one exchange or service can control many addresses. Active addresses are therefore a network-activity measure, not a direct user count.
Does an exchange inflow mean investors are selling?
No. It only means crypto moved into an identified exchange-controlled address. The actual trading decision may happen later—or may not happen at all.
What is the most important on-chain metric?
There is no universal single metric that answers every research question. The appropriate metric depends on whether you are studying network usage, supply, exchange activity, holder profitability or valuation.
Why should I combine several on-chain metrics?
Because each metric captures only one part of blockchain behavior. Combining independent measurements can provide stronger context and help expose misleading signals.
Author & Editorial Information
Author: Deepak Kumar
Publisher: ZenvestAI
Editorial Focus: Digital Assets, Blockchain Data & On-Chain Intelligence
Educational disclosure: This article is provided for educational and informational purposes only. It is not investment, financial, legal or tax advice. On-chain metrics are analytical tools and do not guarantee future market movements. Crypto assets involve substantial risk, including volatility, liquidity risk, technology risk and loss of capital. Readers should conduct independent research and consider their own circumstances before making financial decisions.