Have you ever bought a cryptocurrency that looked “cheap” at $0.05, watched the project announce major partnerships, and still saw your token’s price bleed lower every single month? Or worse have you ever tried to sell a profitable token, only to realize that executing your order wiped out 30% of your gains in seconds?
If you have experienced either frustration, you have run into the two most misunderstood forces in digital asset markets: supply dilution and illiquidity. Most beginners judge a coin by its sticker price and 24-hour percentage gain. Experienced traders know that a token’s dollar price tells you almost nothing on its own.
In this Crypto Market Capitalization and Liquidity: A Deep Dive, you will learn how to look past surface-level prices to evaluate what a crypto asset is truly worth and whether you can actually buy or sell it without getting trapped.
You will master the math behind circulating supply, Fully Diluted Valuation (FDV), order-book depth, and Automated Market Maker (AMM) slippage so you can analyze any token before risking your capital.
💡 ZenvestAI Explains
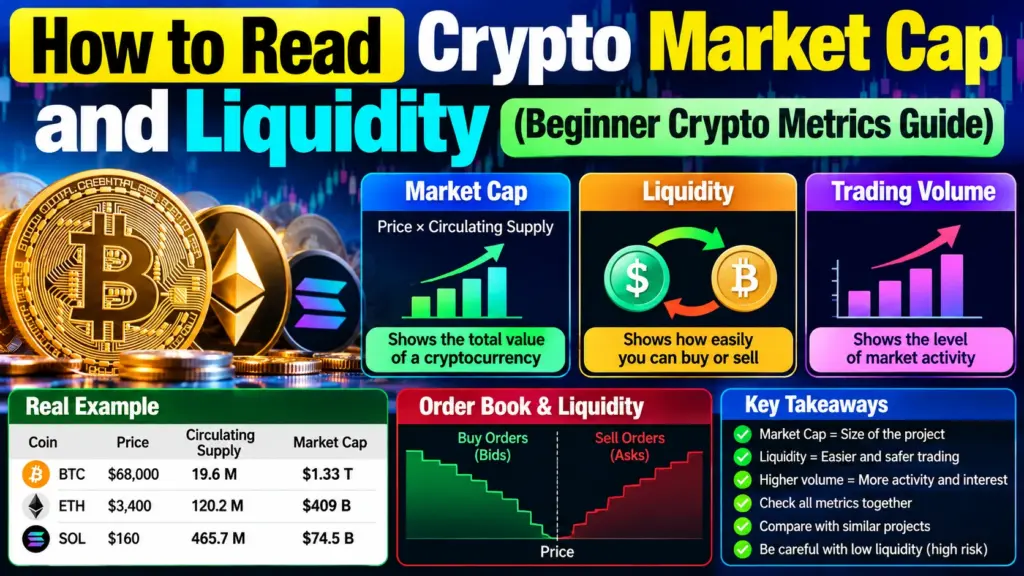
Cryptocurrency market capitalization measures a crypto asset’s total market value by multiplying its current token price by its circulating supply. While market cap tells you how big a project is today, Fully Diluted Valuation (FDV) projects its value once all locked tokens enter circulation.
Liquidity, by contrast, measures how easily you can buy or sell that token without moving its price. Evaluating market cap, FDV, and liquidity together protects you from unit bias, hidden token dilution, and costly price slippage when executing trades.
Key Takeaways
- Price is cosmetic without supply: Market capitalization (
Token Price × Circulating Supply) measures current network valuation, not the nominal price of a single coin. - Watch the Float Ratio (
Market Cap ÷ FDV): A ratio below 0.20 means over 80% of the token supply is still locked. Future token unlocks can crush the token price even if the project’s market cap grows. - Market cap is not cash in a vault: A $1 billion market cap does not mean $1 billion is waiting to buy your tokens. How much you actually pocket when selling depends entirely on liquidity.
- Volume does not equal liquidity: High 24-hour trading volume can be faked through wash trading. True liquidity requires deep CEX order books, tight bid-ask spreads, or large on-chain AMM pools.
- Slippage scales nonlinearly: In Automated Market Makers (
x · y = k), doubling your trade size more than doubles your price impact. Large market orders in shallow pools destroy capital.
At a Glance: Core Valuation & Liquidity Metrics
| Metric | Formula / Definition | What It Tells You | Healthy Benchmark |
| Current Market Cap | Token Price × Circulating Supply | The current market value of all publicly tradable tokens. | Compare against direct category peers. |
| Fully Diluted Valuation (FDV) | Token Price × Max Supply (or Total Supply) | The projected market cap if 100% of tokens were unlocked today. | Should align realistically with long-term adoption. |
| Float Ratio | Current Market Cap ÷ FDV | The fraction of total supply already in public hands. | Greater than 0.60 (Low dilution risk); Less than 0.20 is high risk. |
| Bid-Ask Spread | Lowest Ask Price − Highest Bid Price | The immediate transaction cost of entering or exiting on an order book. | Less than 0.10% on major pairs; wide spreads signal low liquidity. |
| Slippage (Price Impact) | Actual Execution Price − Expected Price | How much your own trade pushes the market price against you. | Less than 0.50% for standard retail trade sizes. |
What This Article Covers
- Market Capitalization and Supply Metrics: Circulating, total, and max supply explained.
- The Dilution Trap: How FDV and tokenomics silently erode holder value (with a worked math example).
- Liquidity Fundamentals: Off-chain order books vs. on-chain AMM liquidity pools.
- Slippage & Real-World Calculations: Exact price impact numbers across pool sizes and a side-by-side comparison of Bitcoin, Ethereum, and Dogecoin.
- Common Pitfalls & Beginner Checklist: How to spot unit bias, wash trading, and liquidity rug pulls before you buy.
What Is Crypto Market Capitalization and How Do Supply Metrics Work?
Cryptocurrency market capitalization is the total dollar value of a coin’s publicly tradable supply, calculated by multiplying the current token price by the circulating supply. Because different blockchains issue, lock, and burn tokens on vastly different schedules, analysts track three distinct supply metrics to understand a coin’s true valuation.
1. Circulating vs. Total vs. Max Supply
- Circulating Supply: The number of tokens that are publicly accessible, liquid, and actively trading in the market right now. This excludes tokens locked in team vesting contracts, foundation treasuries, or protocol time-locks.
- Total Supply: All tokens that have already been minted on the blockchain minus any tokens that have been permanently destroyed (“burned”). Total supply includes both circulating coins and currently locked coins.
- Max Supply: The hard-coded upper limit of tokens that the protocol rules will ever allow to exist.
For example, Bitcoin has a circulating supply of approximately 20.103 million BTC and a hard-coded max supply of 21 million BTC. Ethereum, by contrast, has no fixed max supply cap; it operates with a dynamic total supply of roughly 122.16 million ETH governed by staking issuance and transaction fee burns.
2. Current Market Cap vs. Fully Diluted Valuation (FDV)
Trackers like CoinMarketCap and CoinGecko rank cryptocurrencies by their Current Market Cap:
Market Cap = Token Price × Circulating Supply
Using Bitcoin at a price of roughly $80,694.53 and a circulating supply of 20.103 million BTC, its current market cap is:
$80,694.53 × 20,103,081 ≈ $1.622 Trillion
However, current market cap ignores tokens sitting in locked vesting contracts waiting to be dumped onto the market. To capture the full picture, analysts calculate Fully Diluted Valuation (FDV)—the theoretical market cap if every single planned token were already in circulation:
Fully Diluted Valuation (FDV) = Token Price × Maximum Supply
(Note: If a token has no hard max supply cap, FDV is calculated using Total Supply).
For Bitcoin, multiplying $80,694.53 by its 21 million max supply gives an FDV of roughly $1.695 trillion. Because almost all Bitcoin has already been mined, its current market cap ($1.622T) and its FDV ($1.695T) are nearly identical.
To measure dilution risk across newer tokens, compute the Float Ratio:
Float Ratio = Current Market Cap / FDV = Circulating Supply / Max Supply
- Float Ratio greater than 0.60: Most of the token supply is already circulating in public hands. Future supply shock from unlocks is relatively low.
- Float Ratio less than 0.20: More than 80% of the tokens are still locked up by insiders, early venture capital backers, or the project treasury. Buying a token with a Float Ratio below 0.20 exposes you to severe structural selling pressure as those locked tokens vest.
🔍 ZenvestAI Quick Insight
Token price is merely a cosmetic surface number. Circulating supply determines what an asset is worth today, while Fully Diluted Valuation (FDV) determines the price reality it must defend tomorrow.
Always check the Float Ratio (Market Cap divided by FDV): a ratio below 0.20 warns that massive token unlocks could crush the price even if the project grows.
3. Worked Example: How Token Dilution Crushes Price Even When Market Cap Doubles
The Problem: Retail investors often buy a newly launched token because they believe in the project’s technology, assuming that if the project grows in adoption and market cap, the token price must go up.
Why It Happens: When a project launches with a tiny circulating float and a massive locked supply, the rate of new token unlocks often outpaces the rate of new buyer demand.
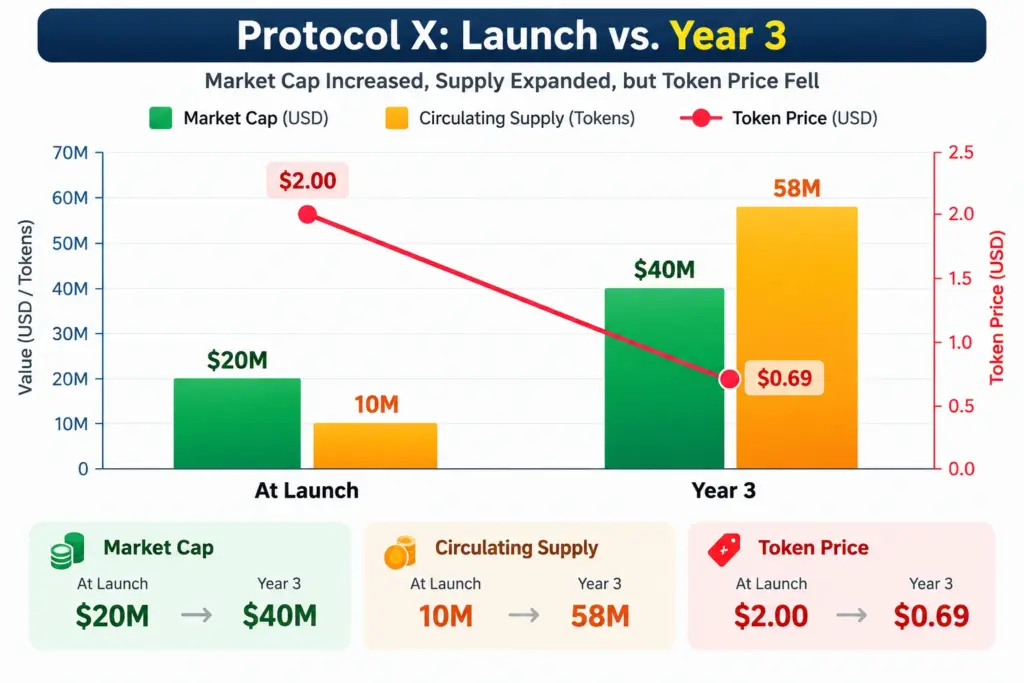
Practical Math Example: Suppose “Protocol X” launches with a max supply of 100 million tokens, of which only 10 million tokens (10% float) are circulating on Day 1 at $2.00 per token:
- Initial Market Cap: $10,000,000 × $2.00 = $20 million
- Initial FDV: $100,000,000 × $2.00 = $200 million
- Initial Float Ratio: $20M ÷ $200M = 0.10 (Warning Zone)
Over the next few years, early investors and team members unlock an additional 48 million tokens, bringing the circulating supply to 58 million tokens (with long-term vesting eventually heading toward 90 million+).
During this period, the protocol succeeds in attracting users, and its Current Market Cap doubles from $20 million to $40 million.
What happens to the price of your token?
New Token Price = New Market Cap ÷ New Circulating Supply = $40,000,000 ÷ 58,000,000 tokens ≈ $0.69
Even though the protocol’s total market valuation doubled (+100%), the token holder suffered a 65.5% loss in price (falling from $2.00 to $0.69) purely due to supply dilution.
4. Tokenomics, Inflation, and Price Discovery
Beyond scheduled unlocks, ongoing protocol emission rules govern long-term price discovery:
Inflationary Models: Networks like Solana or Cosmos mint new tokens continuously on a set schedule to pay validators and stakers. The important catch: If a protocol advertises a 12% staking yield (APY), but inflates its total token supply by 15% per year, stakers actually suffer a net real dilution of −3% unless new buyer demand absorbs the extra supply.
Deflationary Models: Protocols like Ethereum (via EIP-1559) burn a portion of transaction fees with every block. During periods of high network activity, more ETH is burned than issued to validators, shrinking total supply and supporting price discovery.
What Beginners Usually Get Wrong (Unit Bias): Novices frequently fall victim to unit bias—the psychological preference for owning “whole units” of a cheap-looking coin. A beginner would rather buy 100,000 tokens priced at $0.01 than 0.012 units of Bitcoin at $80,694.
Always ask: “$1 of what supply?” A $0.01 coin with a supply of 10 trillion tokens has a $100 billion market cap, making it infinitely harder to double in value than a $100 token with a total supply of just 100,000 coins ($10 million market cap).
Why Market Cap Does Not Equal Tradable Cash
Market liquidity measures how quickly and easily an asset can be bought or sold in the market without causing a significant change in its price. While market cap is a theoretical paper valuation, liquidity determines the actual cash value you can extract when you hit the “Sell” button.
1. Off-Chain (Order Book) vs. On-Chain (AMM) Liquidity
Crypto liquidity lives in two fundamentally different market structures:
Off-Chain Order Books (Centralized Exchanges / CEXs): Exchanges like Binance, Coinbase, or CoinDCX use traditional electronic order books. Buyers post bids (the maximum price they are willing to pay) and sellers post asks (the minimum price they are willing to accept). Liquidity is supplied by institutional market makers and active traders inside the exchange’s internal database.
On-Chain Automated Market Makers (Decentralized Exchanges / DEXs): Protocols like Uniswap, Curve, or Raydium eliminate order books entirely. Instead, they use Automated Market Makers (AMMs) smart contracts that hold two or more tokens inside an on-chain liquidity pool (such as an ETH/USDC pool). Anyone can deposit an equal value of both tokens to become a Liquidity Provider (LP) and earn a share of trading fees. Prices adjust automatically via mathematical formulas, most famously Uniswap’s constant-product equation: x × y = k
Where x is the quantity of Token A in the pool, y is the quantity of Token B, and k is a constant value that must remain unchanged during a trade, excluding fees.
2. Order Book Depth and Bid-Ask Spread
When evaluating liquidity on a centralized exchange, two metrics tell the real story:
Bid-Ask Spread: The gap between the highest bid price and the lowest ask price. A narrow spread (for example, $80,694.00 bid vs. $80,694.50 ask on BTC) signals intense competition among market makers and low transaction friction. Wide spreads on small-cap altcoins act as an invisible tax—you lose 1% to 5% the moment you cross the spread.
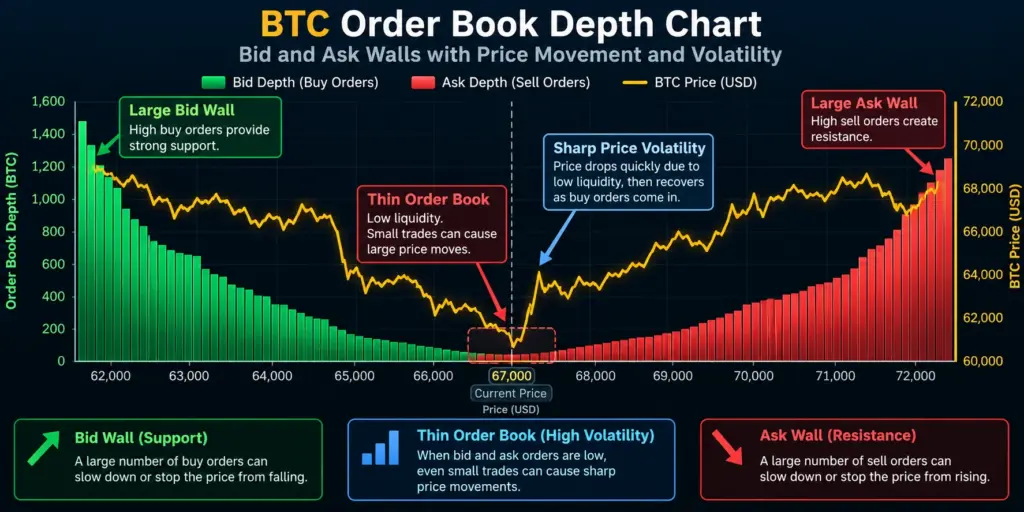
Order Book Depth (2% Depth): Depth measures the total dollar value of buy and sell limit orders stacked within a specific percentage range (commonly ±2%) of the current mid-price.
If a coin has $10 million in +2% ask depth, a whale can market-buy millions of dollars of the token without moving the price by more than 2%. In a shallow order book, even a $5,000 market order can sweep through multiple price levels and cause a violent price spike or crash.
3. Trading Volume vs. Real Liquidity
Beginners often assume that high 24-hour trading volume guarantees high liquidity. This is a dangerous misconception.
Trading volume simply records the cumulative dollar value of trades executed over the past 24 hours.
On unregulated or low-tier exchanges, malicious actors and bots can easily inflate volume through wash trading rapidly buying and selling the same tokens back and forth to themselves at zero net cost.
A token can report $50 million in 24-hour volume while having less than $15,000 of real order-book depth. Always verify ±2% order book depth or on-chain Total Value Locked (TVL) rather than trusting raw volume numbers.
4. Slippage and Price Impact Explained
Slippage is the difference between the expected price of a trade when you click the button and the actual average price at which your order is executed.
The Problem: When you place a market order, you instruct the exchange or DEX to fill your entire order immediately at whatever prices are available. I
f your order size is larger than the liquidity available at the current best price, your order eats through progressively worse prices down the order book or along the AMM curve.
Let’s see some example:– In an infamous documented case in an illiquid Aave market pair, an aggressive buyer executed a market order attempting to spend $50 million without checking order-book depth.
Because the book was virtually empty, the order swept every available ask up to astronomical prices, leaving the buyer with only ~$36,000 worth of real AAVE value an instant 99.9% loss caused entirely by catastrophic negative slippage.
5. AMM Pools and Impermanent Loss
If you decide to earn yield by providing liquidity to a DEX pool, you must understand Impermanent Loss (IL).
Because an AMM pool relies on arbitrage traders to keep its token ratio aligned with outside market prices, whenever one token rises sharply in price relative to the other, the pool automatically sells your appreciating token and accumulates more of the lagging token.
When you withdraw your funds, the total dollar value of your pool share will often be worth less than if you had simply held (HODLed) the two tokens in your wallet.
Only provide liquidity to an AMM pool if you expect the trading fees you earn to exceed the impermanent loss caused by price divergence. (Note: Stable-swap AMMs like Curve use specialized formulas designed for pegged assets like USDC/USDT to minimize both slippage and impermanent loss).
Let’s See Examples
1. How Trade Size Drives Slippage in an AMM Pool
To see how liquidity pool size governs price impact, imagine an on-chain Uniswap v2-style pool containing 1,000,000 Token A (x) and 1,000,000 USDC (y).
Initial Constant Product: k = 1,000,000 × 1,000,000 = 10¹²
Initial Spot Price: 1.00 USDC per Token A
Total Pool Liquidity: $2,000,000
Watch what happens to the new post-trade spot price and effective execution price when a trader swaps increasing amounts of USDC into this exact same pool (ignoring swap fees for simplicity):
| Trade Size (USDC In) | Share of USDC Pool | Tokens Received (Token A) | Average Execution Price | New Spot Price After Trade | Post-Trade Price Impact |
| $1,000 | 0.1% | 999.00 | $1.0010 | ~$1.0020 – $1.0029 | ~0.20% – 0.29% (Negligible) |
| $10,000 | 1.0% | 9,900.99 | $1.0100 | $1.0201 | +2.01% (Noticeable) |
| $100,000 | 10.0% | 90,909.09 | $1.1000 | $1.2100 | +21.00% (Severe) |
| $500,000 | 50.0% | 333,333.33 | $1.5000 | $2.2500 | +125.00% (Price more than doubles) |
The Practical Takeaway:– Slippage grows nonlinearly with trade size. A trade equal to 0.1% of the pool barely registers (~0.2% impact), whereas a trade equal to 50% of the pool spikes the spot price by 125% and costs the trader an average of $1.50 per token instead of $1.00. In a deeper pool with $50 million of liquidity, that same $100,000 trade would execute smoothly with almost zero price impact.
2. Real Token Comparison: Bitcoin vs. Ethereum vs. Dogecoin
The table below compares three well-known cryptocurrencies across different market-cap tiers using late-2026 market data from CoinMarketCap to illustrate how supply, valuation, and liquidity scale in practice:
| Metric | Bitcoin (BTC) — Large-Cap | Ethereum (ETH) — Large/Mid-Cap | Dogecoin (DOGE) — Mid/Low-Cap Scale |
| Circulating Supply | 20,103,081 BTC | 122,158,317 ETH | 172,176,413,127 DOGE |
| Max Supply | 21,000,000 BTC | No fixed cap | No fixed cap |
| Token Price (USD) | $80,694.53 | $2,353.06 | $0.07756 |
| Current Market Cap | $1,622,208,737,823 (~$1.622T) | $287,446,455,774 (~$287.45B) | $13,353,691,755 (~$13.35B) |
| Fully Diluted Valuation (FDV) | ~$1,694,585,130,000 (~$1.695T) | N/A (Dynamic supply) | N/A (Uncapped inflationary) |
| 24-Hour Trading Volume | $21,053,028,917 (~$21.05B) | $9,139,109,433 (~$9.14B) | $640,940,420 (~$640.94M) |
Float Ratio (Cap ÷ FDV) | ~0.96 (96% issued) | — | — |
How to Read These Numbers:
- Bitcoin’s Scarcity & Depth: With 20.103 million of its 21 million max supply already mined, Bitcoin boasts a 0.96 Float Ratio, meaning future mining dilution is minimal (roughly 4% remaining over the next century). Its massive $21.05B daily volume and deep institutional order books allow multi-million-dollar orders to clear with minimal slippage.
- Unit Bias in Action (DOGE vs. ETH): A beginner might think Dogecoin ($0.077) is “cheaper” and has more room to grow than Ethereum ($2,353). Yet Dogecoin’s massive circulating supply of 172.18 billion coins already gives it a $13.35 billion market cap.
- Liquidity Scale: Notice that Dogecoin’s 24-hour volume ($640.94M) is more than 30 times smaller than Bitcoin’s. On individual exchange pairs, a $100,000 market order in DOGE (~1.29 million DOGE) will eat significantly deeper into the order book than a $100,000 order in BTC. As a quick heuristic for small moves, Estimated Slippage ≈ Order Size ÷ Order Book Depth.
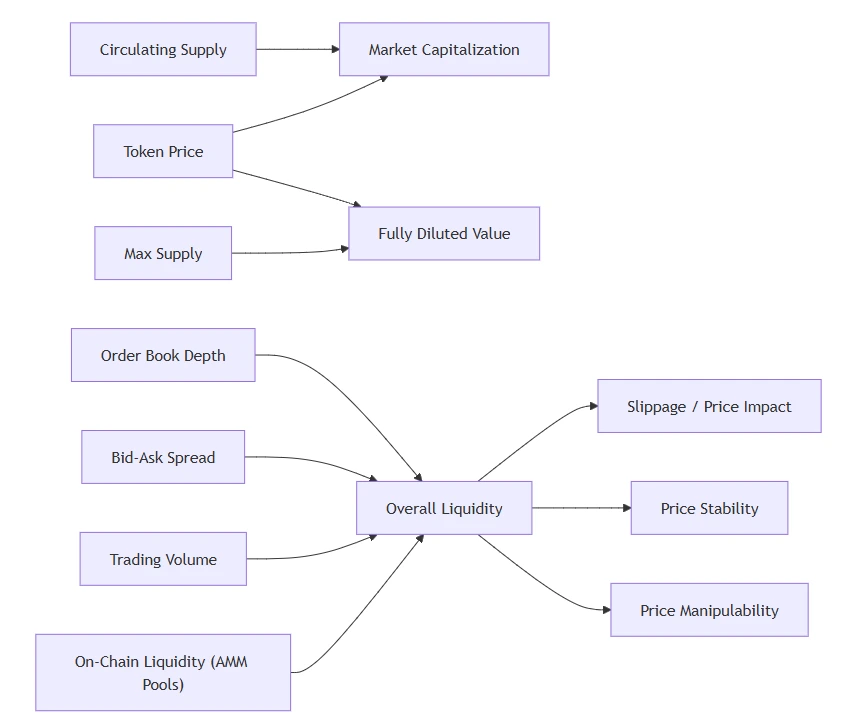
3. Flowchart: How Supply, Market Cap, and Liquidity Interact
The diagram below maps the exact causal chain connecting token supply metrics to market valuation, liquidity depth, and execution risk:
⚠️ Common Pitfalls & What I Would Check First
Before risking capital in any crypto asset, watch out for these seven costly traps—plus a critical reality check for Indian traders:
Unit Bias Trap: Never buy a token just because its price is less than $1.00. Always multiply the target price you hope for by the circulating and max supply to see if the resulting market cap is realistic.
The Low-Float / High-FDV Dilution Trap: Many venture-backed tokens launch with a flashy $100M market cap but a $2 billion FDV (Float Ratio of 0.05). Even if the protocol succeeds, relentless monthly vesting unlocks will turn retail buyers into exit liquidity.
Fake Volume & Wash Trading: If an obscure token ranks #300 by market cap but claims $200 million in 24-hour volume on an unknown exchange, assume it is wash trading. Check CoinGecko or CoinMarketCap’s ±2% Depth column to see if real buy orders exist.
DeFi Liquidity Rug Pulls: On DEXs, anyone can mint a token and pair it with a tiny amount of ETH or USDT. If the project creators hold the unlocked LP tokens, they can withdraw 100% of the pool’s liquidity in one transaction—crashing the token’s tradable value to zero instantaneously. Always verify that LP tokens are burned or locked in an audited time-lock contract.
Ignoring Wide Bid-Ask Spreads: On illiquid CEX pairs, if the highest bid is $0.95 and the lowest ask is $1.02, buying and immediately selling costs you 6.8% before the market even moves.
Leaving DEX Slippage Tolerance Too High: Setting your DEX slippage tolerance to 5% or 10% to force a trade through invites MEV sandwich bots to front-run your order, buy before you, push your execution price to the maximum slippage limit, and sell immediately after you for a risk-free profit.
Blindly Chasing High AMM APRs: A pool offering 200% APR in a volatile altcoin/ETH pair will almost certainly inflict heavy impermanent loss if the altcoin dumps or skyrockets.
What Indian Crypto Investors Must Keep in Mind: If you trade on domestic Indian exchanges using INR pairs, local order books are often significantly thinner than global USDT pairs on international exchanges.
Executing a ₹5,00,000 market order on a mid-cap token in an INR order book can easily trigger 1.5% to 4% slippage. Because Indian tax law already imposes a mandatory 1% TDS (Tax Deducted at Source) on sell transactions under Section 194S and a flat 30% tax on gains (without loss offsetting) under Section 115BBH, losing an extra 2% to 3% on entry and exit slippage can completely wipe out your net post-tax profitability. Always use limit orders when trading INR pairs.
Step-by-Step Guide: How to Audit a Token in 3 Minutes Before Buying
Follow this five-step checklist before executing any crypto trade:
Calculate the Float Ratio (Market Cap ÷ FDV): Look up the asset on CoinMarketCap or CoinGecko. If the ratio is greater than 0.60, dilution risk is manageable. If it is less than 0.20, inspect the token unlock calendar before touching it.
Check the Next 90 Days of Token Unlocks: Visit a vesting tracker (such as Tokenomist or DefiLlama Unlocks) to see if team, investor, or ecosystem cliff unlocks are scheduled in the coming weeks.
Inspect Real Exchange Depth (±2% Depth): Scroll to the “Markets” tab on CoinGecko/CoinMarketCap. Look at the +2% Depth and −2% Depth columns on reputable exchanges. Ensure the depth is at least 50 to 100 times larger than your intended trade size.
Verify On-Chain Pool Health (For DEX Trades): If buying on a DEX, check the pool’s Total Value Locked (TVL) and verify that liquidity is locked. Simulate your swap amount in the DEX interface and check the Price Impact warning—if price impact exceeds 0.5% to 1.0%, split your trade into smaller chunks or use a DEX aggregator (like 1inch or Jupiter).
Execute With Limit Orders or Tight Slippage: On a CEX, always place a limit order rather than a market order so you control your exact execution price. On a DEX, keep your slippage tolerance tight (0.1% to 0.5% for liquid pairs) to protect against sandwich attacks.
Glossary of Key Terms
- Circulating Supply: The total number of tokens currently held by the public and available for active trading.
- Fully Diluted Valuation (FDV): The theoretical market cap of a cryptocurrency if its entire maximum supply were in circulation at the current price.
- Float Ratio: The ratio of Circulating Supply to Max Supply (
Market Cap ÷ FDV), indicating how much of the supply is already unlocked. - Order Book Depth: The cumulative dollar value of open buy (bid) and sell (ask) orders sitting near the current market price on an exchange.
- Slippage: The difference between the expected price of a trade and the actual price at which the order executes due to insufficient liquidity.
- Automated Market Maker (AMM): A decentralized exchange protocol that prices assets algorithmically inside smart-contract liquidity pools (
x · y = k) rather than matching buyers and sellers via an order book. - Impermanent Loss: The temporary (or permanent upon withdrawal) dollar loss experienced by an AMM liquidity provider when the price ratio of their deposited tokens changes compared to simply holding the tokens outside the pool.
Frequently Asked Questions
What is the difference between market cap and Fully Diluted Valuation (FDV) in crypto?
Market cap measures the current value of tokens already in public circulation (Price × Circulating Supply), whereas FDV measures the total projected value if every planned token were unlocked (Price × Max Supply). A large gap between market cap and FDV warns investors that heavy future token supply will enter the market and potentially dilute the price.
Can a cryptocurrency have a high market cap but low liquidity?
Yes—this is common among newly launched, low-float tokens and manipulated micro-cap coins. If a creator mints 1 billion tokens, locks 99.9% of them, and sells a single token in a tiny liquidity pool for $1.00, the token technically registers a $1 billion FDV despite having almost zero tradable liquidity. If anyone tries to sell $10,000 worth of tokens, the price will instantly crash.
Why did I get fewer tokens than expected when swapping on Uniswap or PancakeSwap?
You experienced negative price slippage caused by your trade size relative to the AMM liquidity pool’s depth. When your swap represents a noticeable percentage of the tokens inside the liquidity pool, the constant-product formula (x · y = k) automatically increases the price as your order fills. High slippage settings can also expose your trade to front-running by MEV bots.
What is a good Market Cap to FDV ratio in crypto?
A Market Cap to FDV ratio (Float Ratio) above 0.60 (60%) is generally considered healthy because the majority of tokens are already in circulation. A ratio between 0.30 and 0.60 requires checking the annual inflation rate, while a ratio below 0.20 (20%) signals high dilution risk from upcoming insider or treasury unlocks.
How do I avoid slippage when buying or selling cryptocurrency?
Use limit orders instead of market orders on centralized exchanges, and trade only on pairs with deep order books and tight bid-ask spreads. When trading on decentralized exchanges (DEXs), route your trades through DEX aggregators (which split orders across multiple pools), break large orders into smaller tranches over time (TWAP), and keep your slippage tolerance setting low.
🎯 Final Takeaway: Reading Market Cap and Liquidity Together
The bottom line is simple: never evaluate a cryptocurrency’s price in isolation, and never confuse paper market cap with real, tradable liquidity. A project with a $100 million market cap, a 0.85 Float Ratio, and $20 million in deep order-book liquidity is fundamentally safer to trade than a hyped token sporting a $1 billion FDV, a 0.08 Float Ratio, and shallow liquidity pools. Before you click “Buy” on your next trade, take three minutes to check the circulating vs. max supply, compute the Float Ratio, and inspect the order book depth—your portfolio will thank you when it is time to take profits.
Ready to sharpen your crypto analysis? Explore ZenvestAI’s complete Tokenomics & Risk Management Hub to download our free Pre-Trade Token Audit Worksheet and compare top-liquidity exchanges side by side.